Pep Boys 2013 Annual Report Download - page 98
Download and view the complete annual report
Please find page 98 of the 2013 Pep Boys annual report below. You can navigate through the pages in the report by either clicking on the pages listed below, or by using the keyword search tool below to find specific information within the annual report.-
 1
1 -
2
-
3
-
4
-
5
-
6
-
7
-
8
-
9
-
10
-
11
-
12
-
13
-
14
-
15
-
16
-
17
-
18
-
19
-
20
-
21
-
22
-
23
-
24
-
25
-
26
-
27
-
28
-
29
-
30
-
31
-
32
-
33
-
34
-
35
-
36
-
37
-
38
-
39
-
40
-
41
-
42
-
43
-
44
-
45
-
46
-
47
-
48
-
49
-
50
-
51
-
52
-
53
-
54
-
55
-
56
-
57
-
58
-
59
-
60
-
61
-
62
-
63
-
64
-
65
-
66
-
67
-
68
-
69
-
70
-
71
-
72
-
73
-
74
-
75
-
76
-
77
-
78
-
79
-
80
-
81
-
82
-
83
-
84
-
85
-
86
-
87
-
 88
88 -
 89
89 -
 90
90 -
 91
91 -
 92
92 -
 93
93 -
 94
94 -
 95
95 -
 96
96 -
 97
97 -
 98
98 -
 99
99 -
 100
100 -
 101
101 -
 102
102 -
 103
103 -
 104
104 -
 105
105 -
 106
106 -
 107
107 -
 108
108 -
109
-
110
-
111
-
112
-
113
-
114
-
115
-
116
-
117
-
118
-
119
-
120
-
121
-
122
-
123
-
124
-
125
-
126
-
127
-
128
-
129
-
130
-
131
-
132
-
133
-
134
-
135
-
136
-
137
-
138
-
139
-
140
-
141
-
142
-
143
-
144
-
145
-
146
-
147
-
148
-
149
-
150
-
151
-
152
-
153
-
154
-
155
-
156
-
157
-
158
-
159
-
160
-
161
-
162
-
163
-
164
 |
 |

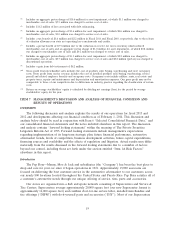
As a result of the foregoing, we reported net earnings of $12.8 million for fiscal 2012 as compared
to net earnings of $28.9 million for fiscal 2012. Our diluted earnings per share were $0.24 as compared
to $0.54 in the prior year period.
Discontinued Operations
The analysis of our results of continuing operations excludes the operating results of closed stores,
where the customer base could not be maintained, which have been classified as discontinued
operations for all periods presented.
Industry Comparison
We operate in the U.S. automotive aftermarket, which has two general lines of business: (1) the
Service business, defined as Do-It-For-Me (service labor, installed merchandise and tires) and (2) the
Retail business, defined as Do-It-Yourself (retail merchandise) and commercial. Generally, specialized
automotive retailers focus on either the Service or Retail area of the business. We believe that
operation in both the Service and Retail areas differentiates us from our competitors. Although we
manage our store performance at a store level in the aggregate, we believe that the following
presentation, which includes the reclassification of revenue from merchandise that we install in
customer vehicles to service center revenue, shows an accurate comparison against competitors within
the two sales arenas. We compete in the Retail area of the business through our retail sales floor and
commercial sales business. Our Service Center business competes in the Service area of the industry.
The following table presents the revenues and gross profit for each area of the business.
Fiscal Year ended
February 1, February 2, January 28,
(dollar amounts in thousands) 2014 2013 2012
Service center revenue(1) ................ $1,110,958 $1,095,284 $1,038,714
Retail sales(2) ........................ 955,610 995,446 1,024,913
Total revenues ....................... $2,066,568 $2,090,730 $2,063,627
Gross profit from service center revenue(3) . . . $ 209,853 $ 208,795 $ 220,314
Gross profit from retail sales(4) ............ 277,524 282,705 289,213
Total gross profit ...................... $ 487,377 $ 491,500 $ 509,527
(1) Includes revenues from installed products.
(2) Excludes revenues from installed products.
(3) Gross profit from service center revenue includes the cost of installed products sold,
buying, warehousing, service center payroll and related employee benefits and service
center occupancy costs. Occupancy costs include utilities, rents, real estate and property
taxes, repairs and maintenance and depreciation and amortization expenses.
(4) Gross profit from retail sales includes the cost of products sold, buying, warehousing and
store occupancy costs. Occupancy costs include utilities, rents, real estate and property
taxes, repairs and maintenance and depreciation and amortization expenses.
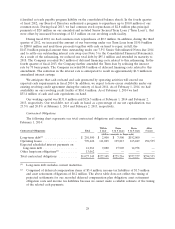
CAPITAL & LIQUIDITY
Capital Resources and Needs
Our cash requirements arise principally from (i) the purchase of inventory and capital expenditures
related to existing and new stores, offices and distribution centers, (ii) debt service and (iii) contractual
26