Pep Boys 2013 Annual Report Download - page 97
Download and view the complete annual report
Please find page 97 of the 2013 Pep Boys annual report below. You can navigate through the pages in the report by either clicking on the pages listed below, or by using the keyword search tool below to find specific information within the annual report.-
 1
1 -
2
-
3
-
4
-
5
-
6
-
7
-
8
-
9
-
10
-
11
-
12
-
13
-
14
-
15
-
16
-
17
-
18
-
19
-
20
-
21
-
22
-
23
-
24
-
25
-
26
-
27
-
28
-
29
-
30
-
31
-
32
-
33
-
34
-
35
-
36
-
37
-
38
-
39
-
40
-
41
-
42
-
43
-
44
-
45
-
46
-
47
-
48
-
49
-
50
-
51
-
52
-
53
-
54
-
55
-
56
-
57
-
58
-
59
-
60
-
61
-
62
-
63
-
64
-
65
-
66
-
67
-
68
-
69
-
70
-
71
-
72
-
73
-
74
-
75
-
76
-
77
-
78
-
79
-
80
-
81
-
82
-
83
-
84
-
85
-
86
-
 87
87 -
 88
88 -
 89
89 -
 90
90 -
 91
91 -
 92
92 -
 93
93 -
 94
94 -
 95
95 -
 96
96 -
 97
97 -
 98
98 -
 99
99 -
 100
100 -
 101
101 -
 102
102 -
 103
103 -
 104
104 -
 105
105 -
 106
106 -
 107
107 -
108
-
109
-
110
-
111
-
112
-
113
-
114
-
115
-
116
-
117
-
118
-
119
-
120
-
121
-
122
-
123
-
124
-
125
-
126
-
127
-
128
-
129
-
130
-
131
-
132
-
133
-
134
-
135
-
136
-
137
-
138
-
139
-
140
-
141
-
142
-
143
-
144
-
145
-
146
-
147
-
148
-
149
-
150
-
151
-
152
-
153
-
154
-
155
-
156
-
157
-
158
-
159
-
160
-
161
-
162
-
163
-
164
 |
 |
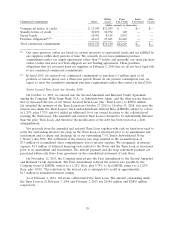
from both years, gross profit margin from merchandise sales remained relatively flat year over year at
29.7%.
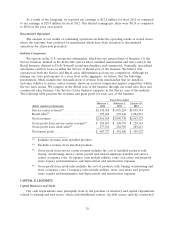
Gross profit from service revenue decreased by $13.5 million, or 64.0%, to $7.5 million for fiscal
2012 from $21.1 million for fiscal 2011. Gross profit margin from service revenue decreased to 1.7% for
fiscal 2012 from 5.0% for fiscal 2011. In accordance with GAAP, service revenue is limited to labor
sales (excludes any revenue from installed parts and materials) and costs of service revenues includes
the fully loaded service center payroll and related employee benefits and service center occupancy
costs. Gross profit from service revenue for fiscal 2012 and 2011 included an asset impairment charge
of $5.4 million and $1.0 million, respectively. Excluding the asset impairment charge, gross profit
margin from service revenue decreased by 234 basis points to 2.9% for fiscal 2012 from 5.3% for fiscal
2011. The decrease in service revenue gross profit margin was primarily due to the growth of our
Service & Tire Centers, which lowered margins by 674 and 579 basis points in fiscal 2012 and 2011,
respectively. Excluding the impact of the Service & Tire Centers, gross profit margin from service
revenue decreased to 9.7% for fiscal 2012 from 11.0% for fiscal 2011. This decrease was due to
increased store occupancy costs such as rent and related expenses and utilities.
Selling, general and administrative expenses as a percentage of total revenues increased to 22.2%
for fiscal year 2012 from 21.5% for fiscal 2011. Selling, general and administrative expenses for fiscal
2012 increased $19.4 million, or 4.4%, to $463.4 million from $444.0 million for fiscal 2011. The
increase resulted primarily from higher media expense of $8.4 million, higher store and administrative
payroll and related expense of $10.4 million (partially from the additional week in fiscal 2012) and
higher legal and professional services costs of $2.3 million, which were partially offset by lower credit
card transaction fees of $3.6 million and the reversal of compensation expense of $0.9 million related to
previously issued performance based stock grants. In addition, in fiscal 2011 we recorded a reduction to
the contingent consideration of $0.7 million related to one of our acquisitions.
In the second quarter of fiscal 2012, we terminated our proposed ‘‘go private’’ transaction and
recorded the settlement proceeds, net of merger related costs, of $42.8 million in the consolidated
statement of operations and comprehensive income.
In the third quarter of fiscal 2012, we restructured our long term debt to reduce the amount
outstanding by $95.1 million and lower our annual interest expense by approximately $11.0 million.
Accordingly, the write-off of deferred financing costs along with the cost to settle the interest rate swap
on the previous debt, partially offset by our lower total debt and reduced interest rate, caused our
interest expense for fiscal 2012 to increase by $7.7 million to $34.0 million as compared to the
$26.3 million for fiscal 2011 (See Note 5 to the Consolidated Financial Statements).
In the fourth quarter of fiscal 2012, we sold our regional administration building in Los Angeles,
CA, which resulted in a net gain from disposition of assets to increase by $1.3 million in fiscal 2012.
In the fourth quarter of fiscal 2012, in accordance with Internal Revenue Service and Pension
Benefit Guaranty Corporation requirements, we contributed $14.1 million to fully fund its Defined
Benefit Pension Plan on a termination basis and incurred a settlement charge of $17.8 million (see
Note 13 to the Consolidated Financial Statements).
Our income tax expense for fiscal 2012 was $9.3 million, or an effective rate of 41.5%, as
compared to an expense of $12.5 million, or an effective rate of 30.0%, for fiscal 2011. The change was
primarily due to a benefit of $3.6 million related to the release of valuation allowances on certain state
net operating loss carry forwards and credits in fiscal 2011. In addition, the rate change from period to
period is primarily driven by a reduction in ordinary income or loss in relation to foreign taxes in our
Puerto Rico operations, state taxes, and other certain permanent tax items.
25