Pep Boys 2013 Annual Report Download - page 22
Download and view the complete annual report
Please find page 22 of the 2013 Pep Boys annual report below. You can navigate through the pages in the report by either clicking on the pages listed below, or by using the keyword search tool below to find specific information within the annual report.-
 1
1 -
2
-
3
-
4
-
5
-
6
-
7
-
8
-
9
-
10
-
11
-
 12
12 -
 13
13 -
 14
14 -
 15
15 -
 16
16 -
 17
17 -
 18
18 -
 19
19 -
 20
20 -
 21
21 -
 22
22 -
 23
23 -
 24
24 -
 25
25 -
 26
26 -
 27
27 -
 28
28 -
 29
29 -
 30
30 -
 31
31 -
 32
32 -
33
-
34
-
35
-
36
-
37
-
38
-
39
-
40
-
41
-
42
-
43
-
44
-
45
-
46
-
47
-
48
-
49
-
50
-
51
-
52
-
53
-
54
-
55
-
56
-
57
-
58
-
59
-
60
-
61
-
62
-
63
-
64
-
65
-
66
-
67
-
68
-
69
-
70
-
71
-
72
-
73
-
74
-
75
-
76
-
77
-
78
-
79
-
80
-
81
-
82
-
83
-
84
-
85
-
86
-
87
-
88
-
89
-
90
-
91
-
92
-
93
-
94
-
95
-
96
-
97
-
98
-
99
-
100
-
101
-
102
-
103
-
104
-
105
-
106
-
107
-
108
-
109
-
110
-
111
-
112
-
113
-
114
-
115
-
116
-
117
-
118
-
119
-
120
-
121
-
122
-
123
-
124
-
125
-
126
-
127
-
128
-
129
-
130
-
131
-
132
-
133
-
134
-
135
-
136
-
137
-
138
-
139
-
140
-
141
-
142
-
143
-
144
-
145
-
146
-
147
-
148
-
149
-
150
-
151
-
152
-
153
-
154
-
155
-
156
-
157
-
158
-
159
-
160
-
161
-
162
-
163
-
164
 |
 |

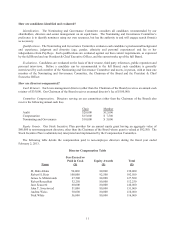
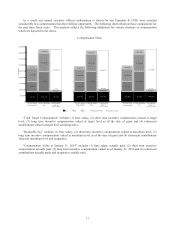
17
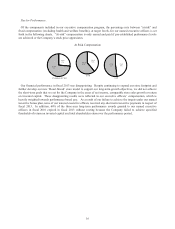
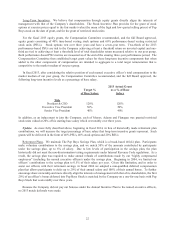
As a result, our named executive officers (information is shown for our President & CEO) were awarded
considerably less compensation than their full pay opportunity. The following charts illustrate those comparisons for
the past three fiscal years. This analysis utilizes the following definitions for various elements of compensation
which are depicted in the charts.
Compensation Value
“Total Target Compensation” includes (1) base salary, (2) short term incentive compensation valued at target
level, (3) long term incentive compensation valued at target level as of the date of grant and (4) retirement
contributions valued at target level and perquisites.
“Realizable Pay” includes (1) base salary, (2) short term incentive compensation valued at maximum level, (3)
long term incentive compensation valued at maximum level as of the date of grant and (4) retirement contributions
valued at maximum level and perquisites.
“Compensation Value at January 31, 2014” includes (1) base salary actually paid, (2) short term incentive
compensation actually paid, (3) long term incentive compensation valued as of January 31, 2014 and (4) retirement
contributions actually made and perquisites actually paid.
$817,693 $817,693 $817,693 $823,462 $823,462 $823,462 $830,000 $830,000 $830,000
$820,000
$1,640,000
$90,119
$830,000
$1,660,000
$830,000
$1,660,000
$1,100,000
$1,485,000
$1,000,000
$1,350,000
$167,880
$1,000,000
$1,350,000
$230,125
$336,725
$232,175
$340,075
$282,825
$415,625
$3,354,381 $3,164,970 $3,269,074
$6,526
$17,225 $17,225
$150,025
$0
$500,000
$1,000,000
$1,500,000
$2,000,000
$2,500,000
$3,000,000
$3,500,000
$4,000,000
$4,500,000
FY 2011 Target
Compensation
FY 2011 Realizable
Pay
Compensation
Value at
Jan. 31, 2014
FY 2012 Target
Compensation
FY 2012 Realizable
Pay
Compensation
Value at
Jan. 31, 2014
FY 2013 Target
Compensation
FY 2013 Realizable
Pay
Compensation
Value at
Jan. 31, 2014
Compensation
Base STI LTI Retirement & Perks Decrease in Value