Pep Boys 2013 Annual Report Download - page 138
Download and view the complete annual report
Please find page 138 of the 2013 Pep Boys annual report below. You can navigate through the pages in the report by either clicking on the pages listed below, or by using the keyword search tool below to find specific information within the annual report.-
 1
1 -
2
-
3
-
4
-
5
-
6
-
7
-
8
-
9
-
10
-
11
-
12
-
13
-
14
-
15
-
16
-
17
-
18
-
19
-
20
-
21
-
22
-
23
-
24
-
25
-
26
-
27
-
28
-
29
-
30
-
31
-
32
-
33
-
34
-
35
-
36
-
37
-
38
-
39
-
40
-
41
-
42
-
43
-
44
-
45
-
46
-
47
-
48
-
49
-
50
-
51
-
52
-
53
-
54
-
55
-
56
-
57
-
58
-
59
-
60
-
61
-
62
-
63
-
64
-
65
-
66
-
67
-
68
-
69
-
70
-
71
-
72
-
73
-
74
-
75
-
76
-
77
-
78
-
79
-
80
-
81
-
82
-
83
-
84
-
85
-
86
-
87
-
88
-
89
-
90
-
91
-
92
-
93
-
94
-
95
-
96
-
97
-
98
-
99
-
100
-
101
-
102
-
103
-
104
-
105
-
106
-
107
-
108
-
109
-
110
-
111
-
112
-
113
-
114
-
115
-
116
-
117
-
118
-
119
-
120
-
121
-
122
-
123
-
124
-
125
-
126
-
127
-
 128
128 -
 129
129 -
 130
130 -
 131
131 -
 132
132 -
 133
133 -
 134
134 -
 135
135 -
 136
136 -
 137
137 -
 138
138 -
 139
139 -
 140
140 -
 141
141 -
 142
142 -
 143
143 -
 144
144 -
 145
145 -
 146
146 -
 147
147 -
 148
148 -
149
-
150
-
151
-
152
-
153
-
154
-
155
-
156
-
157
-
158
-
159
-
160
-
161
-
162
-
163
-
164
 |
 |

THE PEP BOYS—MANNY, MOE & JACK AND SUBSIDIARIES
NOTES TO CONSOLIDATED FINANCIAL STATEMENTS (Continued)
Years ended February 1, 2014, February 2, 2013 and January 28, 2012
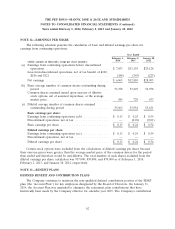
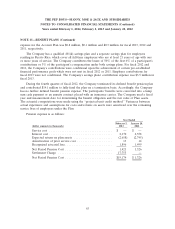
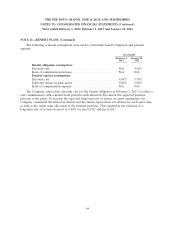
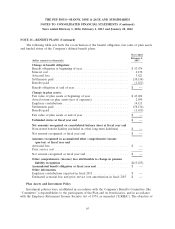
NOTE 13—BENEFIT PLANS (Continued)
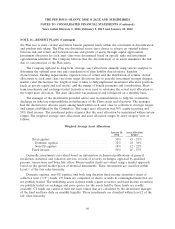
the Plan was to meet current and future benefit payment needs within the constraints of diversification
and prudent risk taking. The Plan was diversified across asset classes to achieve an optimal balance
between risk and return and between income and growth of assets through capital appreciation.
Investment objectives for each asset class were determined based on specific risks and investment
opportunities identified. The Company believes that the diversification of its assets minimizes the risk
due to concentration of the Plan assets.
The Company updated its long-term, strategic asset allocations annually using various analytics to
determine the optimal asset mix and consideration of plan liability characteristics, liquidity
characteristics, funding requirements, expected rates of return and the distribution of returns. Actual
allocations to each asset class vary from target allocations due to periodic investment strategy changes,
market value fluctuations, the length of time it takes to fully implement investment allocation positions
(such as private equity and real estate), and the timing of benefit payments and contributions. Short
term investments and exchange-traded derivatives were used to rebalance the actual asset allocation to
the target asset allocation. The asset allocation was monitored and rebalanced on a monthly basis.
The manager of the investments provided advice and recommendations to help the Committee
discharge its fiduciary responsibilities in furtherance of the Plan’s goals and objectives. The manager
had the discretion to allocate assets among funds within each asset class to conform to strategic targets
and ranges established by the Committee. The target asset allocation was 50% equity securities and
50% fixed income. The investment policy requires that the asset allocation be maintained within certain
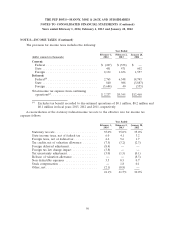
ranges. The weighted average asset allocations and asset allocation ranges by asset category were as
follows:
Weighted Average Asset Allocations
January 28, Asset Allocation
2012 Ranges
Total equities ................................. 50% 45 - 55%
Domestic equities ............................ 32% 28 - 38%
Non-US equities ............................. 18% 12 - 22%
Fixed income ................................. 50% 45 - 55%
Generally, investments are valued based on information in financial publications of general
circulation, statistical and valuation services, records of security exchanges, appraisal by qualified
persons, transactions and bona fide offers. Money market funds are valued using a market approach
based on the quoted market prices of identical instruments. These investments are classified within
Level 1 of the fair value hierarchy.
Domestic equities, non-US equities, and both long duration fixed income securities consist of
collective trust (‘‘CT’’) funds. CT funds are comprised of shares or units in commingled funds that are
not publicly traded. The underlying assets in these funds (equity securities and fixed income securities)
are publicly traded on exchanges and price quotes for the assets held by these funds are readily
available. CT funds are valued at their net asset values that are calculated by the investment manager
of the fund and have daily or monthly liquidity. These investments are classified within Level 2 of the
fair value hierarchy.
66