Pep Boys 2013 Annual Report Download - page 94
Download and view the complete annual report
Please find page 94 of the 2013 Pep Boys annual report below. You can navigate through the pages in the report by either clicking on the pages listed below, or by using the keyword search tool below to find specific information within the annual report.-
 1
1 -
2
-
3
-
4
-
5
-
6
-
7
-
8
-
9
-
10
-
11
-
12
-
13
-
14
-
15
-
16
-
17
-
18
-
19
-
20
-
21
-
22
-
23
-
24
-
25
-
26
-
27
-
28
-
29
-
30
-
31
-
32
-
33
-
34
-
35
-
36
-
37
-
38
-
39
-
40
-
41
-
42
-
43
-
44
-
45
-
46
-
47
-
48
-
49
-
50
-
51
-
52
-
53
-
54
-
55
-
56
-
57
-
58
-
59
-
60
-
61
-
62
-
63
-
64
-
65
-
66
-
67
-
68
-
69
-
70
-
71
-
72
-
73
-
74
-
75
-
76
-
77
-
78
-
79
-
80
-
81
-
82
-
83
-
 84
84 -
 85
85 -
 86
86 -
 87
87 -
 88
88 -
 89
89 -
 90
90 -
 91
91 -
 92
92 -
 93
93 -
 94
94 -
 95
95 -
 96
96 -
 97
97 -
 98
98 -
 99
99 -
 100
100 -
 101
101 -
 102
102 -
 103
103 -
 104
104 -
105
-
106
-
107
-
108
-
109
-
110
-
111
-
112
-
113
-
114
-
115
-
116
-
117
-
118
-
119
-
120
-
121
-
122
-
123
-
124
-
125
-
126
-
127
-
128
-
129
-
130
-
131
-
132
-
133
-
134
-
135
-
136
-
137
-
138
-
139
-
140
-
141
-
142
-
143
-
144
-
145
-
146
-
147
-
148
-
149
-
150
-
151
-
152
-
153
-
154
-
155
-
156
-
157
-
158
-
159
-
160
-
161
-
162
-
163
-
164
 |
 |
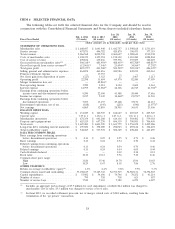
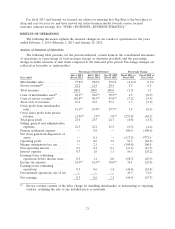
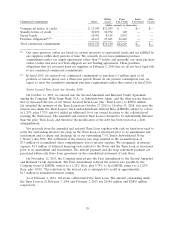
(2) Costs of merchandise sales include the cost of products sold, buying, warehousing and store
occupancy costs. Costs of service revenue include service center payroll and related employee
benefits and service center occupancy costs. Occupancy costs include utilities, rents, real estate and
property taxes, repairs and maintenance and depreciation and amortization expenses.
(3) As a percentage of related sales or revenue, as applicable.
(4) As a percentage of earnings from continuing operations before income taxes.
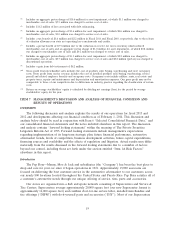
Fiscal 2013 vs. Fiscal 2012
Total revenue for fiscal 2013 decreased by $24.2 million, or 1.2%, to $2,066.6 million from
$2,090.7 million for fiscal 2012. Excluding the fifty-third week in 2012, total revenue increased by
$11.9 million, or 0.6%, while comparable sales decreased 1.3%. The decrease in comparable store sales
was comprised of a 1.6% comparable service revenue increase offset by a 2.1% comparable
merchandise sales decline. The decrease in comparable merchandise sales was primarily due to lower
tires, oil and refrigerant sales. While our total revenues are favorably impacted by the opening of new
stores, a new store is not added to our comparable store sales until it reaches its 13th month of
operation.
Our total online sales are currently an immaterial portion of our total sales and comparable store
sales. Customer online purchases that are picked up at our stores are included in our comparable store
sales calculation. Customer online purchases that are delivered to customers’ homes are not included in
our comparable store sales.
Total merchandise sales decreased 2.1%, or $35.3 million, to $1,608.7 million for fiscal 2013,
compared to $1,643.9 million for fiscal 2012. Excluding the fifty-third week in 2012, total merchandise
sales declined 0.5%, or $7.6 million, while comparable merchandise sales decreased by 2.1%, or
$34.1 million. Our non-comparable stores contributed an additional $26.5 million of merchandise
revenue in fiscal 2013. The decrease in comparable store merchandise sales was driven primarily by
lower tire, oil and refrigerant sales.
Total service revenue increased 2.5%, or $11.1 million, to $457.9 million for fiscal 2013 from
$446.8 million for fiscal 2012. Excluding the fifty-third week in 2012, total service revenue increased
4.5%, or $19.6 million, while comparable service revenue increased by 1.6%, or $6.9 million. Our
non-comparable store locations contributed an additional $12.7 million of service revenues in fiscal
2013. The increase in comparable store service revenue was primarily due to an increase in the average
transaction amount per customer.
In our retail business, we believe that the difficult macroeconomic conditions continue to impact
our customers and led to the comparable store customer counts decline of 4.9%, while we experienced
an increase in the average transaction amount per customer resulting from higher selling prices of
1.8%. In our service business, we believe that we experienced a slight increase in comparable store
customer counts due to the strength of our service offering and our promotion of oil changes.
However, this shift in service sales mix towards lower cost oil changes slightly reduced the average
transaction amount per service customer.
Total gross profit decreased by $4.1 million, or 0.8%, to $487.4 million for fiscal 2013 from
$491.5 million for fiscal 2012. Total gross profit margin increased to 23.6% for fiscal 2013 from 23.5%
for fiscal 2012. Total gross profit for fiscal 2013 and 2012 included an asset impairment charge of
$7.7 million and $10.6 million, respectively. Excluding this item from both years, total gross profit
margin remained relatively flat at 24.0%.
Gross profit from merchandise sales increased by $16.4 million, or 3.4%, to $500.3 million for
fiscal 2013 from $484.0 million for fiscal 2012. Gross profit margin from merchandise sales increased to
22