Pep Boys 2009 Annual Report Download - page 99
Download and view the complete annual report
Please find page 99 of the 2009 Pep Boys annual report below. You can navigate through the pages in the report by either clicking on the pages listed below, or by using the keyword search tool below to find specific information within the annual report.-
 1
1 -
2
-
3
-
4
-
5
-
6
-
7
-
8
-
9
-
10
-
11
-
12
-
13
-
14
-
15
-
16
-
17
-
18
-
19
-
20
-
21
-
22
-
23
-
24
-
25
-
26
-
27
-
28
-
29
-
30
-
31
-
32
-
33
-
34
-
35
-
36
-
37
-
38
-
39
-
40
-
41
-
42
-
43
-
44
-
45
-
46
-
47
-
48
-
49
-
50
-
51
-
52
-
53
-
54
-
55
-
56
-
57
-
58
-
59
-
60
-
61
-
62
-
63
-
64
-
65
-
66
-
67
-
68
-
69
-
70
-
71
-
72
-
73
-
74
-
75
-
76
-
77
-
78
-
79
-
80
-
81
-
82
-
83
-
84
-
85
-
86
-
87
-
88
-
 89
89 -
 90
90 -
 91
91 -
 92
92 -
 93
93 -
 94
94 -
 95
95 -
 96
96 -
 97
97 -
 98
98 -
 99
99 -
 100
100 -
 101
101 -
 102
102 -
 103
103 -
 104
104 -
 105
105 -
 106
106 -
 107
107 -
 108
108 -
 109
109 -
110
-
111
-
112
-
113
-
114
-
115
-
116
-
117
-
118
-
119
-
120
-
121
-
122
-
123
-
124
-
125
-
126
-
127
-
128
-
129
-
130
-
131
-
132
-
133
-
134
-
135
-
136
-
137
-
138
-
139
-
140
-
141
-
142
-
143
-
144
-
145
-
146
-
147
-
148
-
149
-
150
-
151
-
152
-
153
-
154
-
155
-
156
-
157
-
158
-
159
-
160
-
161
-
162
-
163
-
164
 |
 |

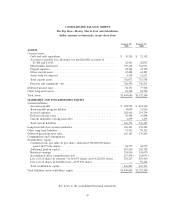
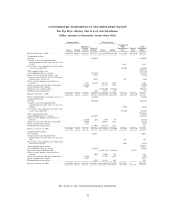
CONSOLIDATED STATEMENTS OF STOCKHOLDERS’ EQUITY
The Pep Boys—Manny, Moe & Jack and Subsidiaries
(dollar amounts in thousands, except share data)
Common Stock Treasury Stock
Accumulated
Additional Other Total
Paid-in Retained Comprehensive Benefit Stockholders’
Shares Amount Capital Earnings Shares Amount Loss Trust Equity
Balance, February 3, 2007 ...........68,557,041 $68,557 $289,384 $463,797 (12,427,687) $(185,339) $ (9,380) $(59,264) $567,755
Comprehensive loss:
Net loss ..................... (41,039) (41,039)
Changes in net unrecognized other
postretirement benefit costs, net of tax of
$1,455 ..................... 2,462 2,462
Fair market value adjustment on derivatives,
net of tax of ($4,367) ............ (7,388) (7,388)
Total comprehensive loss ............ (45,965)
Cash dividends ($.27 per share) ........ (14,177) (14,177)
Effect of uncertainty for income taxes .... (155) (155)
Change in measurement date of retirement
benefit effect, net of tax ........... (189) 123 (66)
Effect of stock options and related tax
benefits .................... 1,752 (1,332) 291,125 4,984 5,404
Effect of restricted stock unit conversions . . (4,818) 176,256 3,038 (1,780)
Stock compensation expense ......... 9,756 9,756
Repurchase of common stock ......... (2,702,460) (50,841) (50,841)
Dividend reinvestment plan .......... (86) 53,672 867 781
Balance, February 2, 2008 ...........68,557,041 68,557 296,074 406,819 (14,609,094) (227,291) (14,183) (59,264) 470,712
Effect of Split Dollar accounting, net of tax . (1,165) (1,165)
Comprehensive loss:
Net loss ..................... (30,429) (30,429)
Changes in net unrecognized other
postretirement benefit costs, net of tax of
($566) ..................... (958) (958)
Fair market value adjustment on derivatives,
net of tax of ($1,734) ............ (2,934) (2,934)
Total comprehensive loss ............ (34,321)
Cash dividends ($.27 per share) ........ (14,111) (14,111)
Effect of stock options and related tax
benefits .................... (1,154) (37) 3,750 60 (1,131)
Effect of restricted stock unit conversions . . (4,935) 279,458 4,512 (423)
Stock compensation expense ......... 2,743 2,743
Dividend reinvestment plan .......... (2,407) 201,865 3,259 852
Balance, January 31, 2009 ...........68,557,041 68,557 292,728 358,670 (14,124,021) (219,460) (18,075) (59,264) 423,156
Comprehensive income:
Net earnings ................... 23,036 23,036
Changes in net unrecognized other
postretirement benefit costs, net of tax of
$352 ...................... 595 595
Fair market value adjustment on derivatives,
net of tax of ($125) ............. (211) (211)
Total comprehensive income .......... 23,420
Cash dividends ($.12 per share) ........ (6,286) (6,286)
Reclassification of Benefits Trust ....... (2,195,270) (59,264) 59,264 —
Effect of stock options and related tax
benefits .................... (209) 22,000 355 146
Effect of restricted stock unit conversions . . (1,493) 81,726 1,321 (172)
Stock compensation expense ......... 2,575 2,575
Dividend reinvestment plan .......... (375) 51,491 831 456
Balance, January 30, 2010 ...........68,557,041 $68,557 $293,810 $374,836 (16,164,074) $(276,217) $(17,691) $ — $443,295
See notes to the consolidated financial statements
41