Pep Boys 2009 Annual Report Download - page 100
Download and view the complete annual report
Please find page 100 of the 2009 Pep Boys annual report below. You can navigate through the pages in the report by either clicking on the pages listed below, or by using the keyword search tool below to find specific information within the annual report.-
 1
1 -
2
-
3
-
4
-
5
-
6
-
7
-
8
-
9
-
10
-
11
-
12
-
13
-
14
-
15
-
16
-
17
-
18
-
19
-
20
-
21
-
22
-
23
-
24
-
25
-
26
-
27
-
28
-
29
-
30
-
31
-
32
-
33
-
34
-
35
-
36
-
37
-
38
-
39
-
40
-
41
-
42
-
43
-
44
-
45
-
46
-
47
-
48
-
49
-
50
-
51
-
52
-
53
-
54
-
55
-
56
-
57
-
58
-
59
-
60
-
61
-
62
-
63
-
64
-
65
-
66
-
67
-
68
-
69
-
70
-
71
-
72
-
73
-
74
-
75
-
76
-
77
-
78
-
79
-
80
-
81
-
82
-
83
-
84
-
85
-
86
-
87
-
88
-
89
-
 90
90 -
 91
91 -
 92
92 -
 93
93 -
 94
94 -
 95
95 -
 96
96 -
 97
97 -
 98
98 -
 99
99 -
 100
100 -
 101
101 -
 102
102 -
 103
103 -
 104
104 -
 105
105 -
 106
106 -
 107
107 -
 108
108 -
 109
109 -
 110
110 -
111
-
112
-
113
-
114
-
115
-
116
-
117
-
118
-
119
-
120
-
121
-
122
-
123
-
124
-
125
-
126
-
127
-
128
-
129
-
130
-
131
-
132
-
133
-
134
-
135
-
136
-
137
-
138
-
139
-
140
-
141
-
142
-
143
-
144
-
145
-
146
-
147
-
148
-
149
-
150
-
151
-
152
-
153
-
154
-
155
-
156
-
157
-
158
-
159
-
160
-
161
-
162
-
163
-
164
 |
 |

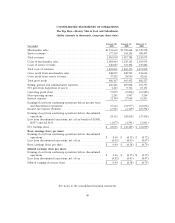
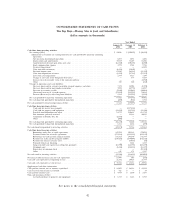
CONSOLIDATED STATEMENTS OF CASH FLOWS
The Pep Boys—Manny, Moe & Jack and Subsidiaries
(dollar amounts in thousands)
Year Ended
January 30, January 31, February 2,
2010 2009 2008
Cash flows from operating activities:
Net earnings (loss) ............................................... $ 23,036 $ (30,429) $ (41,039)
Adjustments to reconcile net earnings (loss) to net cash provided by (used in) continuing
operations:
Net loss from discontinued operations ................................. 1,077 1,591 3,601
Depreciation and amortization ...................................... 70,529 73,207 81,036
Amortization of deferred gain from asset sales ............................ (12,325) (10,285) (1,030)
Stock compensation expense ....................................... 2,575 2,743 9,756
Inventory impairment ........................................... — — 32,803
Gain from debt retirement ........................................ (6,248) (3,460) —
Deferred income taxes .......................................... 13,446 (6,258) (28,187)
Gain from dispositions of assets ..................................... (1,213) (9,716) (15,151)
Loss from asset impairment ....................................... 2,884 3,427 7,199
Change in fair value of de-designated derivatives ........................... — 177 9,268
Increase in cash surrender value of life insurance policies ...................... — — (4,928)
Other .................................................... 345 360 (828)
Changes in operating assets and liabilities:
Decrease (increase) in accounts receivable, prepaid expenses and other .............. 7,175 23,904 (1,579)
Decrease (increase) in merchandise inventories ............................ 7,039 (3,779) 13,087
Decrease in accounts payable ...................................... (9,640) (33,083) (20,066)
(Decrease) increase in accrued expenses ................................ (13,238) (34,993) 10,083
Increase (decrease) in other long-term liabilities ........................... 2,384 (11,992) (3,224)
Net cash provided by (used in) continuing operations ........................... 87,826 (38,586) 50,801
Net cash (used in) provided by discontinued operations .......................... (603) (921) 1,983
Net cash provided by (used in) operating activities .............................. 87,223 (39,507) 52,784
Cash flows from investing activities:
Cash paid for master lease property ................................... — (117,121) —
Cash paid for property and equipment ................................. (43,214) (34,762) (43,116)
Proceeds from dispositions of assets ................................... 14,776 210,635 162,712
Life insurance proceeds received .................................... — 15,588 30,045
Acquisition of Florida Tire, Inc. ..................................... (2,695) — —
Other .................................................... (500) — —
Net cash (used in) provided by continuing operations ........................... (31,633) 74,340 149,641
Net cash provided by (used in) discontinued operations .......................... 1,762 4,386 (379)
Net cash (used in) provided by investing activities .............................. (29,871) 78,726 149,262
Cash flows from financing activities:
Borrowings under line of credit agreements .............................. 249,704 205,162 570,094
Payments under line of credit agreements ............................... (273,566) (223,345) (545,617)
Borrowings on trade payable program liability ............................. 192,324 196,680 142,884
Payments on trade payable program liability .............................. (190,155) (179,004) (142,620)
Payments for finance issuance costs ................................... — (6,936) (85)
Proceeds from lease financing ...................................... — 8,661 4,827
Long-term debt and capital lease obligation payments ........................ (11,990) (26,798) (165,695)
Dividends paid ............................................... (6,286) (14,111) (14,177)
Repurchase of common stock ...................................... — — (58,152)
Other .................................................... 611 878 5,537
Net cash used in financing activities ....................................... (39,358) (38,813) (203,004)
Net increase (decrease) in cash and cash equivalents ............................. 17,994 406 (958)
Cash and cash equivalents at beginning of year ................................ 21,332 20,926 21,884
Cash and cash equivalents at end of year .................................... $ 39,326 $ 21,332 $ 20,926
Supplemental cash flow information:
Cash paid for interest, net of amounts capitalized ............................... $ 24,509 $ 26,548 $ 44,129
Cash received from income tax refunds ..................................... $ 921 $ — $ 59
Cash paid for income taxes ............................................ $ 4,768 $ 1,330 $ 3,147
Non-cash investing activities:
Accrued purchases of property and equipment ............................ $ 1,738 $ 1,214 $ 1,985
See notes to the consolidated financial statements
42