Pep Boys 2009 Annual Report Download - page 81
Download and view the complete annual report
Please find page 81 of the 2009 Pep Boys annual report below. You can navigate through the pages in the report by either clicking on the pages listed below, or by using the keyword search tool below to find specific information within the annual report.-
 1
1 -
2
-
3
-
4
-
5
-
6
-
7
-
8
-
9
-
10
-
11
-
12
-
13
-
14
-
15
-
16
-
17
-
18
-
19
-
20
-
21
-
22
-
23
-
24
-
25
-
26
-
27
-
28
-
29
-
30
-
31
-
32
-
33
-
34
-
35
-
36
-
37
-
38
-
39
-
40
-
41
-
42
-
43
-
44
-
45
-
46
-
47
-
48
-
49
-
50
-
51
-
52
-
53
-
54
-
55
-
56
-
57
-
58
-
59
-
60
-
61
-
62
-
63
-
64
-
65
-
66
-
67
-
68
-
69
-
70
-
 71
71 -
 72
72 -
 73
73 -
 74
74 -
 75
75 -
 76
76 -
 77
77 -
 78
78 -
 79
79 -
 80
80 -
 81
81 -
 82
82 -
 83
83 -
 84
84 -
 85
85 -
 86
86 -
 87
87 -
 88
88 -
 89
89 -
 90
90 -
 91
91 -
92
-
93
-
94
-
95
-
96
-
97
-
98
-
99
-
100
-
101
-
102
-
103
-
104
-
105
-
106
-
107
-
108
-
109
-
110
-
111
-
112
-
113
-
114
-
115
-
116
-
117
-
118
-
119
-
120
-
121
-
122
-
123
-
124
-
125
-
126
-
127
-
128
-
129
-
130
-
131
-
132
-
133
-
134
-
135
-
136
-
137
-
138
-
139
-
140
-
141
-
142
-
143
-
144
-
145
-
146
-
147
-
148
-
149
-
150
-
151
-
152
-
153
-
154
-
155
-
156
-
157
-
158
-
159
-
160
-
161
-
162
-
163
-
164
 |
 |
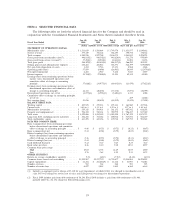
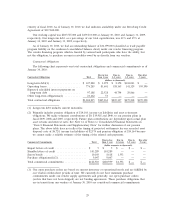
(2) Costs of merchandise sales include the cost of products sold, buying, warehousing and store occupancy
costs. Costs of service revenue include service center payroll and related employee benefits and service
center occupancy costs. Occupancy costs include utilities, rents, real estate and property taxes, repairs
and maintenance and depreciation and amortization expenses.
(3) As a percentage of related sales or revenue, as applicable.
(4) As a percentage of loss from continuing operations before income taxes
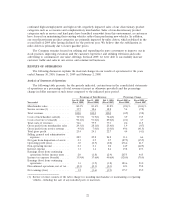
Fiscal 2009 vs. Fiscal 2008
Total revenue and comparable sales for fiscal 2009 decreased 0.9% and 1.2%, respectively as
compared to the prior year. The 1.2% decrease in comparable store revenues consisted of a 4.7%
increase in comparable service revenue offset by a 2.6% decrease in comparable merchandise sales.
While our total revenue figures were favorably impacted by our opening of 25 new stores in fiscal 2009,
a new store is not added to our comparable store sales base until it reaches its 13th month of
operation. Stores are removed from the comparable store sales base upon their relocation or closure.
Once a relocated store reaches its 13th month of operation at its new location, it is added back into
our comparable store sales base. Square footage increases are immaterial and accordingly, are not
considered in our calculations of comparable store sales data.
Total merchandise sales decreased 2.3% to $1,533,619,000 compared to $1,569,664,000 in fiscal
2008. Total service revenue increased 5.4% to $377,319,000 from $358,124,000 in the prior year. The
decrease in merchandise sales was primarily due to weaker sales in our retail business stemming from
less discretionary spending by our customers and lower DIY customer counts. Excluding sales of
discretionary products such as generators, electronics and transportation products, our DIY core
automotive sales remained relatively flat year over year. Service revenues increased in fiscal 2009 as
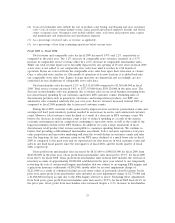
compared to fiscal 2008 primarily due to increased customer counts.
During fiscal 2009, customer traffic generated by improved store execution, promotional events and
an improved hard parts inventory position resulted in an increase in service and commercial customer
count. However, total customer count declined as a result of a decrease in DIY customer count. We
believe the decrease in retail customer count is due to reduced spending as a result of the current
economic environment and our competitors continuing to open new stores as well as the result of the
long-term industry decline in the DIY business. In addition, we carry a large assortment of more
discretionary retail product that is more susceptible to consumer spending deferrals. We continue to
believe that providing a differentiated merchandise assortment, better customer experience, low-price
value proposition and innovative marketing will stem the overall decline in customer counts and sales
over the long-term. In fact, customer count in our DIY space declined at a much lower rate in fiscal
2009 as compared to the prior year and we experienced our first increase in total customer count and
sales in our third fiscal quarter since the first quarter of fiscal 2004, and the fourth quarter of fiscal
2006, respectively.
Gross profit from merchandise sales increased by $8,313,000 to $448,815,000 for fiscal 2009 from
$440,502,000 in the prior year. Gross profit from merchandise sales increased to 29.3% for fiscal 2009
from 28.1% for fiscal 2008. Gross profit from merchandise sales in fiscal 2009 includes the reversal of
inventory accruals of approximately $2,000,000 established in the prior year related to our temporarily
restricting the sale of certain small engine merchandise that was subject to an ongoing EPA inquiry and
a gain from insurance settlements of $562,000, mostly offset by an asset impairment charge of
$2,211,000 as a result of continued declines in real estate values of previously closed locations. In the
prior year, gross profit from merchandise sales included an asset impairment charge of $2,779,000 and
a $3,000,000 inventory accrual due to the EPA inquiry referred to above. Excluding these adjustments
from both years, gross profit from merchandise sales increased to 29.2% for fiscal 2009 from 28.4% in
the prior year. Gross profit from merchandise sales increased despite a 2.3% decrease in merchandise
23