Pep Boys 2009 Annual Report Download - page 142
Download and view the complete annual report
Please find page 142 of the 2009 Pep Boys annual report below. You can navigate through the pages in the report by either clicking on the pages listed below, or by using the keyword search tool below to find specific information within the annual report.-
 1
1 -
2
-
3
-
4
-
5
-
6
-
7
-
8
-
9
-
10
-
11
-
12
-
13
-
14
-
15
-
16
-
17
-
18
-
19
-
20
-
21
-
22
-
23
-
24
-
25
-
26
-
27
-
28
-
29
-
30
-
31
-
32
-
33
-
34
-
35
-
36
-
37
-
38
-
39
-
40
-
41
-
42
-
43
-
44
-
45
-
46
-
47
-
48
-
49
-
50
-
51
-
52
-
53
-
54
-
55
-
56
-
57
-
58
-
59
-
60
-
61
-
62
-
63
-
64
-
65
-
66
-
67
-
68
-
69
-
70
-
71
-
72
-
73
-
74
-
75
-
76
-
77
-
78
-
79
-
80
-
81
-
82
-
83
-
84
-
85
-
86
-
87
-
88
-
89
-
90
-
91
-
92
-
93
-
94
-
95
-
96
-
97
-
98
-
99
-
100
-
101
-
102
-
103
-
104
-
105
-
106
-
107
-
108
-
109
-
110
-
111
-
112
-
113
-
114
-
115
-
116
-
117
-
118
-
119
-
120
-
121
-
122
-
123
-
124
-
125
-
126
-
127
-
128
-
129
-
130
-
131
-
 132
132 -
 133
133 -
 134
134 -
 135
135 -
 136
136 -
 137
137 -
 138
138 -
 139
139 -
 140
140 -
 141
141 -
 142
142 -
 143
143 -
 144
144 -
 145
145 -
 146
146 -
 147
147 -
 148
148 -
 149
149 -
 150
150 -
 151
151 -
 152
152 -
153
-
154
-
155
-
156
-
157
-
158
-
159
-
160
-
161
-
162
-
163
-
164
 |
 |

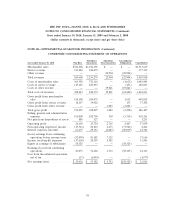
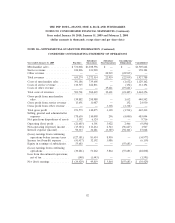
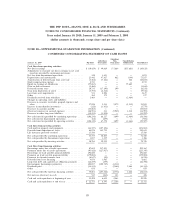
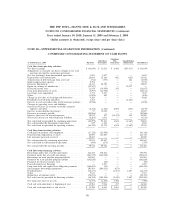
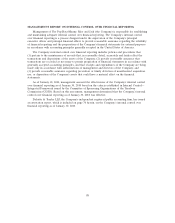
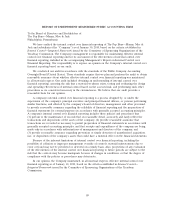
THE PEP BOYS—MANNY, MOE & JACK AND SUBSIDIARIES
NOTES TO CONSOLIDATED FINANCIAL STATEMENTS (Continued)
Years ended January 30, 2010, January 31, 2009 and February 2, 2008
(dollar amounts in thousands, except share and per share data)
NOTE 20—SUPPLEMENTAL GUARANTOR INFORMATION (Continued)
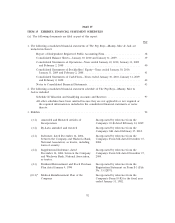
CONDENSED CONSOLIDATING STATEMENT OF CASH FLOWS
Subsidiary
Subsidiary Non- Consolidation
January 30, 2010 Pep Boys Guarantors Guarantors Elimination Consolidated
Cash flows from operating activities:
Net earnings (loss) .......................... $ 23,036 $ 53,582 $ 4,743 $(58,325) $ 23,036
Adjustments to reconcile net earnings (loss) to net cash
(used in) provided by continuing operations:
Net loss from discontinued operations .............. 37 1,040 — — 1,077
Depreciation and amortization ................... 25,405 44,815 682 (373) 70,529
Amortization of deferred gain from asset sales ........ (4,078) (8,620) — 373 (12,325)
Stock compensation expense .................... 2,575 — — — 2,575
Equity in earnings of subsidiaries ................. (58,325) — — 58,325 —
Gain on debt retirement ...................... (6,248) — — — (6,248)
Deferred income taxes ........................ 2,919 10,147 380 — 13,446
Gain from disposition of assets .................. (886) (327) — — (1,213)
Loss from asset impairments .................... 785 2,099 — — 2,884
Dividends received from subsidiary ................ 2,467 — — (2,467) —
Other .................................. 204 141 — — 345
Changes in operating assets and liabilities:
Decrease (increase) in accounts receivable, prepaid
expenses and other ........................ 8,232 520 (957) (620) 7,175
Decrease in merchandise inventories ............... 5,216 1,823 — — 7,039
Decrease in accounts payable ................... (9,640) — — — (9,640)
Decrease in accrued expenses ................... (5,303) (5,999) (2,556) 620 (13,238)
(Decrease) increase in other long-term liabilities ....... (790) 3,174 — — 2,384
Net cash (used in) provided by continuing operations .... (14,394) 102,395 2,292 (2,467) 87,826
Net cash used in discontinued operations ............ (37) (566) — — (603)
Net cash (used in) provided by operating activities ...... (14,431) 101,829 2,292 (2,467) 87,223
Cash flows from investing activities:
Cash paid for property and equipment .............. (18,132) (25,082) — — (43,214)
Proceeds from disposition of assets ................ 4,845 9,931 — — 14,776
Acquisition of Florida Tire, Inc. ................. (2,695) — — — (2,695)
Other .................................. (500) — — — (500)
Net cash used in continuing operations ............. (16,482) (15,151) — — (31,633)
Net cash provided by discontinued operations ......... — 1,762 — — 1,762
Net cash used in investing activities ............... (16,482) (13,389) — — (29,871)
Cash flows from financing activities:
Borrowings under line of credit agreements .......... 88,237 161,467 — — 249,704
Payments under line of credit agreements ............ (96,669) (176,897) — — (273,566)
Borrowings on trade payable program liability ......... 192,324 — — — 192,324
Payments on trade payable program liability .......... (190,155) — — — (190,155)
Long-term debt and capital lease obligation payments .... (11,930) (60) — — (11,990)
Intercompany borrowings (payments) .............. 67,872 (69,064) 1,192 — —
Dividends paid ............................. (6,286) — (2,467) 2,467 (6,286)
Other .................................. 611 — — — 611
Net cash provided by (used in) financing activities ...... 44,004 (84,554) (1,275) 2,467 (39,358)
Net increase in cash ......................... 13,091 3,886 1,017 — 17,994
Cash and cash equivalents at beginning of year ........ 12,753 6,393 2,186 — 21,332
Cash and cash equivalents at end of year ............ $ 25,844 $ 10,279 $ 3,203 $ — $ 39,326
84