Pep Boys 2009 Annual Report Download - page 84
Download and view the complete annual report
Please find page 84 of the 2009 Pep Boys annual report below. You can navigate through the pages in the report by either clicking on the pages listed below, or by using the keyword search tool below to find specific information within the annual report.-
 1
1 -
2
-
3
-
4
-
5
-
6
-
7
-
8
-
9
-
10
-
11
-
12
-
13
-
14
-
15
-
16
-
17
-
18
-
19
-
20
-
21
-
22
-
23
-
24
-
25
-
26
-
27
-
28
-
29
-
30
-
31
-
32
-
33
-
34
-
35
-
36
-
37
-
38
-
39
-
40
-
41
-
42
-
43
-
44
-
45
-
46
-
47
-
48
-
49
-
50
-
51
-
52
-
53
-
54
-
55
-
56
-
57
-
58
-
59
-
60
-
61
-
62
-
63
-
64
-
65
-
66
-
67
-
68
-
69
-
70
-
71
-
72
-
73
-
 74
74 -
 75
75 -
 76
76 -
 77
77 -
 78
78 -
 79
79 -
 80
80 -
 81
81 -
 82
82 -
 83
83 -
 84
84 -
 85
85 -
 86
86 -
 87
87 -
 88
88 -
 89
89 -
 90
90 -
 91
91 -
 92
92 -
 93
93 -
 94
94 -
95
-
96
-
97
-
98
-
99
-
100
-
101
-
102
-
103
-
104
-
105
-
106
-
107
-
108
-
109
-
110
-
111
-
112
-
113
-
114
-
115
-
116
-
117
-
118
-
119
-
120
-
121
-
122
-
123
-
124
-
125
-
126
-
127
-
128
-
129
-
130
-
131
-
132
-
133
-
134
-
135
-
136
-
137
-
138
-
139
-
140
-
141
-
142
-
143
-
144
-
145
-
146
-
147
-
148
-
149
-
150
-
151
-
152
-
153
-
154
-
155
-
156
-
157
-
158
-
159
-
160
-
161
-
162
-
163
-
164
 |
 |
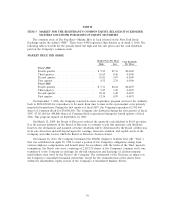
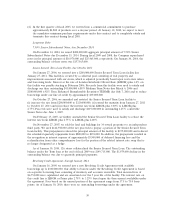
of our Senior Secured Term Loan facility and the reclassification from other comprehensive loss for the
portion of the related interest rate swap that is no longer designated as a hedge. Excluding these
adjustments, interest expense declined by $16,057,000 or 35.4%.
Non-operating income as a percentage of total revenues decreased from 0.2% in fiscal 2007 to
0.1% in fiscal 2008. This decrease of $3,279,000 was due to lower investment balances in fiscal 2008 as
compared to fiscal 2007.
Loss from discontinued operations was $1,591,000 in fiscal 2008 versus $3,601,000, in fiscal 2007.
Fiscal 2008 included impairment charges of $1,926,000 due to declines in real estate values. Fiscal 2007
included impairment charges of $3,764,000 due to 11 store closures in the fourth quarter of fiscal 2007.
Our income tax benefit as a percentage of loss from continuing operations before income taxes
was 17.6%, or $6,139,000, for fiscal 2008 versus 40.6%, or $25,594,000, for fiscal 2007. The decline in
the effective rate was due to the non-deductibility of certain expenses for tax purposes, the recognition
of a gain for tax on the surrender of life insurance policies and the establishment of a valuation
allowance on certain state net operating losses and credits.
As a result of the foregoing, our net loss decreased by $10,610,000 in fiscal 2008 to $30,429,000
from $41,039,000 in fiscal 2007. The Company’s basic and diluted loss per share improved $0.21 per
share in fiscal 2008 to a loss of $0.58 per share versus a loss of $0.79 per share in fiscal 2007.
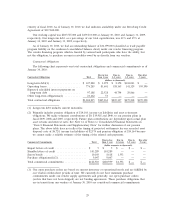
Discontinued Operations
In the third quarter of fiscal 2007, we adopted our long-term strategic plan. One of the initial steps
in this plan was the identification of 31 low-return stores for closure. We have accounted for these
store closures and recognize impairments in accordance with the provisions established for exit or
disposal activities. Accordingly, our discontinued operations for all periods presented reflect the
operating results for 11 of the 31 closed stores because we do not believe that the customers of these
stores are likely to become customers of other Pep Boys stores due to geographical considerations. The
operating results for the other 20 closed stores are included in continuing operations because we
believe that the customers of these stores are likely to become customers of other Pep Boys stores that
are in close proximity.
The analysis of our results of continuing operations excludes the operating results of the above-
referenced 11 stores which have been classified as discontinued operations for all periods presented.
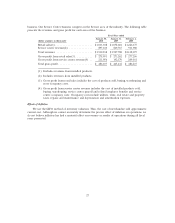
Industry Comparison
We operate in the U.S. automotive aftermarket, which has two general lines of business: the
Service Business defined as Do-It-For-Me (service labor, installed merchandise and tires) and the
Retail Business defined as Do-It-Yourself (retail merchandise) and commercial. Generally, specialized
automotive retailers focus on either the Retail or Service area of the business. We believe that
operation in both the Retail and Service areas positively differentiates us from most of our competitors.
Although we manage our performance at a store level in aggregation, we believe that the following
presentation, which includes the reclassification of revenue from installed products from retail sales to
service center revenue, shows an accurate comparison against competitors within the two sales arenas.
We compete in the Retail area of the business through our retail sales floor and commercial sales
26