Pep Boys 2009 Annual Report Download - page 112
Download and view the complete annual report
Please find page 112 of the 2009 Pep Boys annual report below. You can navigate through the pages in the report by either clicking on the pages listed below, or by using the keyword search tool below to find specific information within the annual report.-
 1
1 -
2
-
3
-
4
-
5
-
6
-
7
-
8
-
9
-
10
-
11
-
12
-
13
-
14
-
15
-
16
-
17
-
18
-
19
-
20
-
21
-
22
-
23
-
24
-
25
-
26
-
27
-
28
-
29
-
30
-
31
-
32
-
33
-
34
-
35
-
36
-
37
-
38
-
39
-
40
-
41
-
42
-
43
-
44
-
45
-
46
-
47
-
48
-
49
-
50
-
51
-
52
-
53
-
54
-
55
-
56
-
57
-
58
-
59
-
60
-
61
-
62
-
63
-
64
-
65
-
66
-
67
-
68
-
69
-
70
-
71
-
72
-
73
-
74
-
75
-
76
-
77
-
78
-
79
-
80
-
81
-
82
-
83
-
84
-
85
-
86
-
87
-
88
-
89
-
90
-
91
-
92
-
93
-
94
-
95
-
96
-
97
-
98
-
99
-
100
-
101
-
 102
102 -
 103
103 -
 104
104 -
 105
105 -
 106
106 -
 107
107 -
 108
108 -
 109
109 -
 110
110 -
 111
111 -
 112
112 -
 113
113 -
 114
114 -
 115
115 -
 116
116 -
 117
117 -
 118
118 -
 119
119 -
 120
120 -
 121
121 -
 122
122 -
123
-
124
-
125
-
126
-
127
-
128
-
129
-
130
-
131
-
132
-
133
-
134
-
135
-
136
-
137
-
138
-
139
-
140
-
141
-
142
-
143
-
144
-
145
-
146
-
147
-
148
-
149
-
150
-
151
-
152
-
153
-
154
-
155
-
156
-
157
-
158
-
159
-
160
-
161
-
162
-
163
-
164
 |
 |

THE PEP BOYS—MANNY, MOE & JACK AND SUBSIDIARIES
NOTES TO CONSOLIDATED FINANCIAL STATEMENTS (Continued)
Years ended January 30, 2010, January 31, 2009 and February 2, 2008
(dollar amounts in thousands, except share and per share data)
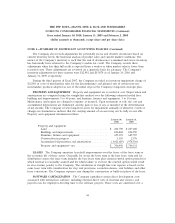
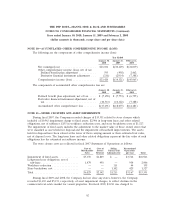
NOTE 5—DEBT AND FINANCING ARRANGEMENTS (Continued)
outstanding import letters of credit and $103,289 and $86,502 in outstanding standby letters of credit as
of January 30, 2010 and January 31, 2009, respectively.
We are also contingently liable for surety bonds in the amount of approximately $10,169 and
$9,235 as of January 30, 2010 and January 31, 2009, respectively. The surety bonds guarantee certain of
our payments (for example utilities, easement repairs, licensing requirements and customs fees).
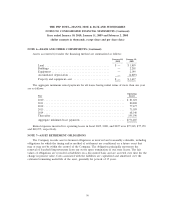
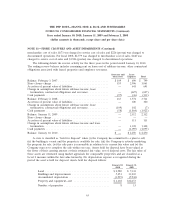
The annual maturities of all long-term debt for the next five fiscal years are:
Fiscal Year Long-Term Debt
2010 Senior Secured Term Loan, due October 2013 ........ $ 1,079
2011 Senior Secured Term Loan, due October 2013 ........ 1,079
2012 Senior Secured Term Loan, due October 2013 ........ 1,079
2013 Senior Secured Term Loan, due October 2013 ........ 146,478
2014 7.50% Senior Subordinated Notes, due December 2014 . 157,565
Thereafter ........................................... —
Total ...................................... $307,280
Interest rates that are currently available to the Company for issuance of debt with similar terms
and remaining maturities are used to estimate fair value for debt issues that are not quoted on an
exchange. The estimated fair value of long-term debt including current maturities was $290,754 and
$200,276 as of January 30, 2010 and January 31, 2009.
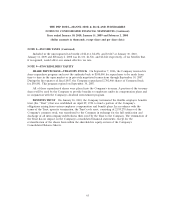
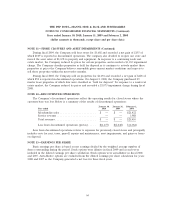
NOTE 6—LEASE AND OTHER COMMITMENTS
On November 27, 2007, the Company sold the land and buildings for 34 owned properties to an
independent third party. Net proceeds from this sale were $162,918. Concurrent with the sale, the
Company entered into agreements to lease the stores back from the purchaser over minimum lease
terms of 15 years. Each property has a separate lease with an initial term of 15 years and four five-year
renewal options. The leases contain provisions to set rent at fair market value upon exercise of the
renewal options. The leases have yearly incremental rental increases based on either CPI, with certain
limitations, or fair market value. The Company discounted the minimum lease payments, reflecting
escalation amounts, during the initial term of 15 years using its then incremental borrowing rate. For
properties where the value of the land was greater than 25% of the property value, the building
component was evaluated separately. The Company classified 33 of these leases as operating leases,
actively uses these properties and considers the leases as normal leasebacks. Gain on the sales of these
properties of $13,971 was recognized immediately upon execution of the sale and an $87,625 gain was
deferred. The immediate gain represents those properties sold where the realized gain exceeds the
present value of the minimum lease payments. The deferred gain is being recognized over the
minimum term of these leases. The Company determined that it had continuing involvement in one
property relating to an environmental indemnity and recorded $4,742 of the transaction’s total net
proceeds as a borrowing and as a financing activity in the Statement of Cash Flows. During the first
quarter of fiscal 2009, the Company provided the necessary documentation to satisfy its indemnity and
54