Pep Boys 2009 Annual Report Download - page 83
Download and view the complete annual report
Please find page 83 of the 2009 Pep Boys annual report below. You can navigate through the pages in the report by either clicking on the pages listed below, or by using the keyword search tool below to find specific information within the annual report.-
 1
1 -
2
-
3
-
4
-
5
-
6
-
7
-
8
-
9
-
10
-
11
-
12
-
13
-
14
-
15
-
16
-
17
-
18
-
19
-
20
-
21
-
22
-
23
-
24
-
25
-
26
-
27
-
28
-
29
-
30
-
31
-
32
-
33
-
34
-
35
-
36
-
37
-
38
-
39
-
40
-
41
-
42
-
43
-
44
-
45
-
46
-
47
-
48
-
49
-
50
-
51
-
52
-
53
-
54
-
55
-
56
-
57
-
58
-
59
-
60
-
61
-
62
-
63
-
64
-
65
-
66
-
67
-
68
-
69
-
70
-
71
-
72
-
 73
73 -
 74
74 -
 75
75 -
 76
76 -
 77
77 -
 78
78 -
 79
79 -
 80
80 -
 81
81 -
 82
82 -
 83
83 -
 84
84 -
 85
85 -
 86
86 -
 87
87 -
 88
88 -
 89
89 -
 90
90 -
 91
91 -
 92
92 -
 93
93 -
94
-
95
-
96
-
97
-
98
-
99
-
100
-
101
-
102
-
103
-
104
-
105
-
106
-
107
-
108
-
109
-
110
-
111
-
112
-
113
-
114
-
115
-
116
-
117
-
118
-
119
-
120
-
121
-
122
-
123
-
124
-
125
-
126
-
127
-
128
-
129
-
130
-
131
-
132
-
133
-
134
-
135
-
136
-
137
-
138
-
139
-
140
-
141
-
142
-
143
-
144
-
145
-
146
-
147
-
148
-
149
-
150
-
151
-
152
-
153
-
154
-
155
-
156
-
157
-
158
-
159
-
160
-
161
-
162
-
163
-
164
 |
 |
In late fiscal 2007 and the first half of fiscal 2008, as part of our long-term strategic plan, we
rebalanced our inventory through an aggressive mark-down and sell through program of non-core and
unproductive merchandise in order to allow us to allocate a larger portion of our inventory investment
to core automotive merchandise. This action was taken because our core automotive merchandise,
which is utilized in each of our lines of business (DIY and DIFM) carries a higher gross product
margin, requires less promotional activity and communicates to our customers our commitment to
fulfilling all of their automotive aftermarket needs. Merchandise sales declined in fiscal 2008 as
compared to fiscal 2007 as a result of our decision to exit non-core and unproductive products and
lower customer counts.
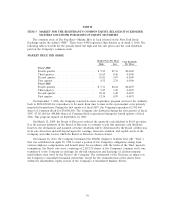
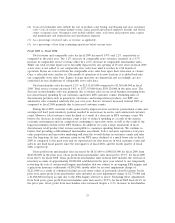
Gross profit from merchandise sales increased, as a percentage of merchandise sales, to 28.1% in
fiscal 2008 from 25.4% in fiscal 2007. The decrease in dollars was $3,124,000 or a 0.7% decrease from
fiscal 2007. The prior year included an inventory impairment charge of $32,803,000 and a $5,350,000
asset impairment charge resulting from the closure of 20 stores. Included in fiscal 2008 is an asset and
inventory impairment charge of $5,779,000. The asset impairment charge was primarily for certain
closed locations as a result of the decline in real estate values and the inventory impairment charge was
due to our temporarily restricting certain small engine merchandise for sale that is the subject of an
ongoing EPA inquiry. Excluding these adjustments from both years, gross profit as a percent of
merchandise sales increased from 27.5% in fiscal 2007 to 28.4 in fiscal 2008. In dollars, merchandise
gross profit decreased $35,498,000 or 7.4% primarily due to reduced merchandise sales. A further
breakdown of our gross profit from merchandise sales excluding the items mentioned above is as
follows: Our product gross margins improved by 170 basis points to 44.4% and warehousing costs
declined by 16 basis points to 4.0% of merchandise sales. These improvements were partially offset by
increased occupancy costs of 90 basis points as a result of increased rental obligations stemming from
the sale-leaseback transactions.
Gross profit from service revenue declined as a percentage of service revenue to 7.0% in fiscal
2008 from 11.0% in fiscal 2007. Gross profit dollars from service revenue declined by 41.5% in fiscal
2008 or $17,681,000 from fiscal 2007. The fiscal 2007 included a $1,849,000 asset impairment charge
related to the closure of 20 closed stores while fiscal 2008 included an additional asset impairment
charge of $648,000. Excluding these adjustments, gross profit from service revenue declined by
$18,882,000. As a percentage of service revenues, gross margin declined from 11.4% in fiscal 2007 to
7.1% in fiscal 2008 primarily due to a $30,373,000 decline in service revenue as discussed above and
higher workers compensation expense, partly offset by lower service payroll and related expenses. The
decline in sales volume resulted in reduced leverage of fixed expenses such as occupancy costs and to a
certain extent labor costs.
Selling, general and administrative expenses, as a percentage of total revenues, increased to 25.2%
for fiscal 2008 as compared to 24.2% for fiscal 2007, however total selling general and administrative
expenses declined by $33,329,000 or 6.4% over the prior year. This decrease in dollars was the result of
expense control initiatives, with major reductions in compensation and compensation related benefits of
$29,377,000 and lower media expense of $4,776,000 as compared to the same period in fiscal 2007.
Net gain from disposition of assets for fiscal 2008 and fiscal 2007 reflect gains of $9,716,000 and
$15,151,000, respectively. The $5,435,000 decrease resulted from the decline in the immediate
recognition of gain on the sale leaseback transactions that were completed in the prior year as
compared to those completed in the current year.
Interest expense decreased $24,245,000 or 47.3% to $27,048,000 in fiscal 2008 from $51,293,000 in
fiscal 2007 primarily due to reduced debt levels as a result of applying proceeds from our sale
leaseback transactions. Included in fiscal 2008 are a gain of $3,460,000 due to debt repurchases and a
$1,172,000 charge for deferred financing costs related to our previous credit facility. Fiscal 2007
includes a $5,900,000 charge for deferred financing costs resulting from the repayment of $162,558,000
25