Pep Boys 2009 Annual Report Download - page 98
Download and view the complete annual report
Please find page 98 of the 2009 Pep Boys annual report below. You can navigate through the pages in the report by either clicking on the pages listed below, or by using the keyword search tool below to find specific information within the annual report.-
 1
1 -
2
-
3
-
4
-
5
-
6
-
7
-
8
-
9
-
10
-
11
-
12
-
13
-
14
-
15
-
16
-
17
-
18
-
19
-
20
-
21
-
22
-
23
-
24
-
25
-
26
-
27
-
28
-
29
-
30
-
31
-
32
-
33
-
34
-
35
-
36
-
37
-
38
-
39
-
40
-
41
-
42
-
43
-
44
-
45
-
46
-
47
-
48
-
49
-
50
-
51
-
52
-
53
-
54
-
55
-
56
-
57
-
58
-
59
-
60
-
61
-
62
-
63
-
64
-
65
-
66
-
67
-
68
-
69
-
70
-
71
-
72
-
73
-
74
-
75
-
76
-
77
-
78
-
79
-
80
-
81
-
82
-
83
-
84
-
85
-
86
-
87
-
 88
88 -
 89
89 -
 90
90 -
 91
91 -
 92
92 -
 93
93 -
 94
94 -
 95
95 -
 96
96 -
 97
97 -
 98
98 -
 99
99 -
 100
100 -
 101
101 -
 102
102 -
 103
103 -
 104
104 -
 105
105 -
 106
106 -
 107
107 -
 108
108 -
109
-
110
-
111
-
112
-
113
-
114
-
115
-
116
-
117
-
118
-
119
-
120
-
121
-
122
-
123
-
124
-
125
-
126
-
127
-
128
-
129
-
130
-
131
-
132
-
133
-
134
-
135
-
136
-
137
-
138
-
139
-
140
-
141
-
142
-
143
-
144
-
145
-
146
-
147
-
148
-
149
-
150
-
151
-
152
-
153
-
154
-
155
-
156
-
157
-
158
-
159
-
160
-
161
-
162
-
163
-
164
 |
 |

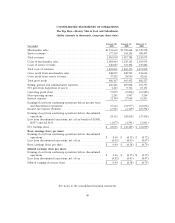
CONSOLIDATED STATEMENTS OF OPERATIONS
The Pep Boys—Manny, Moe & Jack and Subsidiaries
(dollar amounts in thousands, except per share data)
January 30, January 31, February 2,
Year ended 2010 2009 2008
Merchandise sales .................................. $1,533,619 $1,569,664 $1,749,578
Service revenue .................................... 377,319 358,124 388,497
Total revenues ..................................... 1,910,938 1,927,788 2,138,075
Costs of merchandise sales ............................ 1,084,804 1,129,162 1,305,952
Costs of service revenue .............................. 340,027 333,194 345,886
Total costs of revenues ............................... 1,424,831 1,462,356 1,651,838
Gross profit from merchandise sales ..................... 448,815 440,502 443,626
Gross profit from service revenue ....................... 37,292 24,930 42,611
Total gross profit ................................... 486,107 465,432 486,237
Selling, general and administrative expenses ............... 430,261 485,044 518,373
Net gain from disposition of assets ...................... 1,213 9,716 15,151
Operating profit (loss) ............................... 57,059 (9,896) (16,985)
Non-operating income ............................... 2,261 1,967 5,246
Interest expense ................................... 21,704 27,048 51,293
Earnings (loss) from continuing operations before income taxes
and discontinued operations ......................... 37,616 (34,977) (63,032)
Income tax expense (benefit) .......................... 13,503 (6,139) (25,594)
Earnings (loss) from continuing operations before discontinued
operations ...................................... 24,113 (28,838) (37,438)
Loss from discontinued operations, net of tax benefit of $(580),
$(857) and $(2,463) ............................... (1,077) (1,591) (3,601)
Net earnings (loss) .................................. $ 23,036 $ (30,429) $ (41,039)
Basic earnings (loss) per share:
Earnings (loss) from continuing operations before discontinued
operations ...................................... $ 0.46 $ (0.55) $ (0.72)
Loss from discontinued operations, net of tax .............. (0.02) (0.03) (0.07)
Basic earnings (loss) per share ......................... $ 0.44 $ (0.58) $ (0.79)
Diluted earnings (loss) per share:
Earnings (loss) from continuing operations before discontinued
operations ...................................... $ 0.46 $ (0.55) $ (0.72)
Loss from discontinued operations, net of tax .............. (0.02) (0.03) (0.07)
Diluted earnings (loss) per share ....................... $ 0.44 $ (0.58) $ (0.79)
See notes to the consolidated financial statements
40