Pep Boys 2009 Annual Report Download - page 124
Download and view the complete annual report
Please find page 124 of the 2009 Pep Boys annual report below. You can navigate through the pages in the report by either clicking on the pages listed below, or by using the keyword search tool below to find specific information within the annual report.-
 1
1 -
2
-
3
-
4
-
5
-
6
-
7
-
8
-
9
-
10
-
11
-
12
-
13
-
14
-
15
-
16
-
17
-
18
-
19
-
20
-
21
-
22
-
23
-
24
-
25
-
26
-
27
-
28
-
29
-
30
-
31
-
32
-
33
-
34
-
35
-
36
-
37
-
38
-
39
-
40
-
41
-
42
-
43
-
44
-
45
-
46
-
47
-
48
-
49
-
50
-
51
-
52
-
53
-
54
-
55
-
56
-
57
-
58
-
59
-
60
-
61
-
62
-
63
-
64
-
65
-
66
-
67
-
68
-
69
-
70
-
71
-
72
-
73
-
74
-
75
-
76
-
77
-
78
-
79
-
80
-
81
-
82
-
83
-
84
-
85
-
86
-
87
-
88
-
89
-
90
-
91
-
92
-
93
-
94
-
95
-
96
-
97
-
98
-
99
-
100
-
101
-
102
-
103
-
104
-
105
-
106
-
107
-
108
-
109
-
110
-
111
-
112
-
113
-
 114
114 -
 115
115 -
 116
116 -
 117
117 -
 118
118 -
 119
119 -
 120
120 -
 121
121 -
 122
122 -
 123
123 -
 124
124 -
 125
125 -
 126
126 -
 127
127 -
 128
128 -
 129
129 -
 130
130 -
 131
131 -
 132
132 -
 133
133 -
 134
134 -
135
-
136
-
137
-
138
-
139
-
140
-
141
-
142
-
143
-
144
-
145
-
146
-
147
-
148
-
149
-
150
-
151
-
152
-
153
-
154
-
155
-
156
-
157
-
158
-
159
-
160
-
161
-
162
-
163
-
164
 |
 |

THE PEP BOYS—MANNY, MOE & JACK AND SUBSIDIARIES
NOTES TO CONSOLIDATED FINANCIAL STATEMENTS (Continued)
Years ended January 30, 2010, January 31, 2009 and February 2, 2008
(dollar amounts in thousands, except share and per share data)
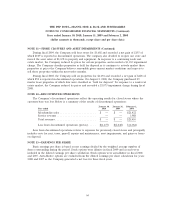
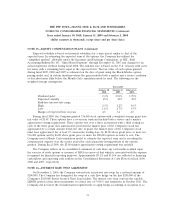
NOTE 14—BENEFIT PLANS (Continued)
The Company has a qualified 401(k) savings plan and a separate savings plan for employees
residing in Puerto Rico, which cover all full-time employees who are at least 21 years of age with one
or more years of service. The Company contributes the lesser of 50% of the first 6% of a participant’s
contributions or 3% of the participant’s compensation under both savings plans. The Company’s savings
plans’ contribution expense was $3,111, $3,286 and $3,480 in fiscal 2009, 2008 and 2007, respectively.
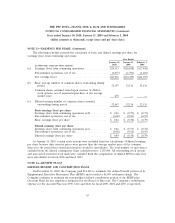
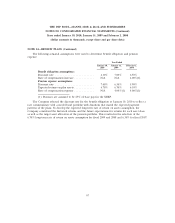
We also have a defined benefit pension plan covering our full-time employees hired on or before
February 1, 1992. As of December 31, 1996, the Company froze the accrued benefits under the plan
and active participants became fully vested. The plan’s trustee will continue to maintain and invest plan
assets and will administer benefits payments. The Company uses a fiscal year end measurement date
for determining benefit obligations and the fair value of plan assets of its plans. The actuarial
computations are made using the ‘‘projected unit credit method.’’ Variances between actual experience
and assumptions for costs and returns on assets are amortized over the remaining service lives of
employees under the plan.
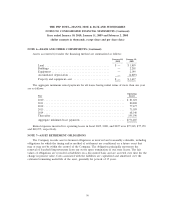
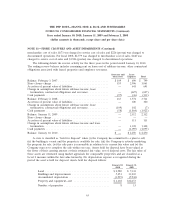
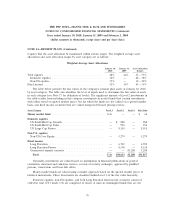
Pension expense follows:
Year Ended
January 30, January 31, February 2,
2010 2009 2008
Service cost ............................ $ — $ 110 $ 166
Interest cost ........................... 2,539 3,346 3,419
Expected return on plan assets .............. (1,804) (2,450) (2,320)
Amortization of transitional obligation ........ — 150 163
Amortization of prior service cost ............ 14 340 370
Recognized actuarial loss .................. 1,766 975 1,814
Net periodic benefit cost .................. 2,515 2,471 3,612
Settlement charge ....................... — 6,005 —
Total pension expense .................... $2,515 $ 8,476 $ 3,612
66