Pep Boys 2009 Annual Report Download - page 76
Download and view the complete annual report
Please find page 76 of the 2009 Pep Boys annual report below. You can navigate through the pages in the report by either clicking on the pages listed below, or by using the keyword search tool below to find specific information within the annual report.-
 1
1 -
2
-
3
-
4
-
5
-
6
-
7
-
8
-
9
-
10
-
11
-
12
-
13
-
14
-
15
-
16
-
17
-
18
-
19
-
20
-
21
-
22
-
23
-
24
-
25
-
26
-
27
-
28
-
29
-
30
-
31
-
32
-
33
-
34
-
35
-
36
-
37
-
38
-
39
-
40
-
41
-
42
-
43
-
44
-
45
-
46
-
47
-
48
-
49
-
50
-
51
-
52
-
53
-
54
-
55
-
56
-
57
-
58
-
59
-
60
-
61
-
62
-
63
-
64
-
65
-
 66
66 -
 67
67 -
 68
68 -
 69
69 -
 70
70 -
 71
71 -
 72
72 -
 73
73 -
 74
74 -
 75
75 -
 76
76 -
 77
77 -
 78
78 -
 79
79 -
 80
80 -
 81
81 -
 82
82 -
 83
83 -
 84
84 -
 85
85 -
 86
86 -
87
-
88
-
89
-
90
-
91
-
92
-
93
-
94
-
95
-
96
-
97
-
98
-
99
-
100
-
101
-
102
-
103
-
104
-
105
-
106
-
107
-
108
-
109
-
110
-
111
-
112
-
113
-
114
-
115
-
116
-
117
-
118
-
119
-
120
-
121
-
122
-
123
-
124
-
125
-
126
-
127
-
128
-
129
-
130
-
131
-
132
-
133
-
134
-
135
-
136
-
137
-
138
-
139
-
140
-
141
-
142
-
143
-
144
-
145
-
146
-
147
-
148
-
149
-
150
-
151
-
152
-
153
-
154
-
155
-
156
-
157
-
158
-
159
-
160
-
161
-
162
-
163
-
164
 |
 |
8APR201019223557
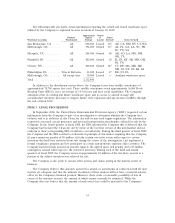
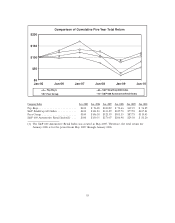
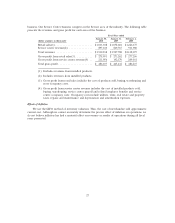
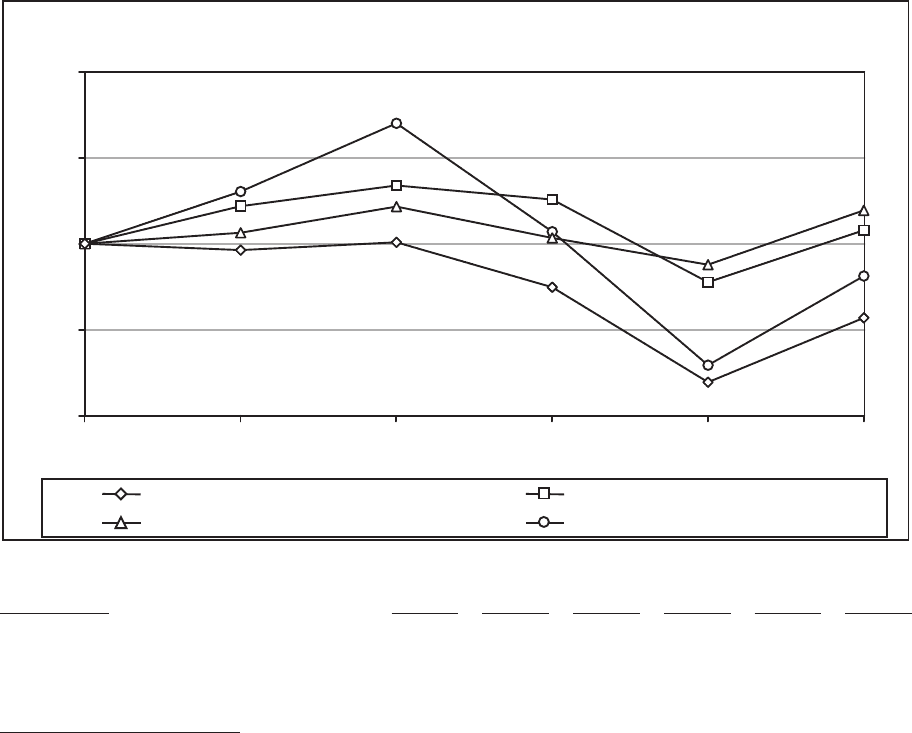
Comparison of Cumulative Five Year Total Return
$200
$150
$100
$50
$0
Jan-05 Jan-06 Jan-07 Jan-08 Jan-10Jan-09
Pep Boys
Peer Group
S&P SmallCap 600 Index
S&P 600 Automotive Retail Index
Company/Index Jan. 2005 Jan. 2006 Jan. 2007 Jan. 2008 Jan. 2009 Jan. 2010
Pep Boys ........................ $100 $ 96.28 $100.82 $ 74.66 $19.39 $ 56.85
S&P SmallCap 600 Index ............ $100 $121.83 $133.89 $125.70 $77.58 $107.81
Peer Group ...................... $100 $106.38 $121.59 $103.35 $87.78 $119.43
S&P 600 Automotive Retail Index(1) . . . $100 $130.35 $170.07 $106.98 $29.30 $ 81.20
(1) The S&P 600 Automotive Retail Index was created in May 2005. Therefore, the total return for
January 2006 is for the period from May 2005 through January 2006.
18