Pep Boys 2009 Annual Report Download - page 85
Download and view the complete annual report
Please find page 85 of the 2009 Pep Boys annual report below. You can navigate through the pages in the report by either clicking on the pages listed below, or by using the keyword search tool below to find specific information within the annual report.-
 1
1 -
2
-
3
-
4
-
5
-
6
-
7
-
8
-
9
-
10
-
11
-
12
-
13
-
14
-
15
-
16
-
17
-
18
-
19
-
20
-
21
-
22
-
23
-
24
-
25
-
26
-
27
-
28
-
29
-
30
-
31
-
32
-
33
-
34
-
35
-
36
-
37
-
38
-
39
-
40
-
41
-
42
-
43
-
44
-
45
-
46
-
47
-
48
-
49
-
50
-
51
-
52
-
53
-
54
-
55
-
56
-
57
-
58
-
59
-
60
-
61
-
62
-
63
-
64
-
65
-
66
-
67
-
68
-
69
-
70
-
71
-
72
-
73
-
74
-
 75
75 -
 76
76 -
 77
77 -
 78
78 -
 79
79 -
 80
80 -
 81
81 -
 82
82 -
 83
83 -
 84
84 -
 85
85 -
 86
86 -
 87
87 -
 88
88 -
 89
89 -
 90
90 -
 91
91 -
 92
92 -
 93
93 -
 94
94 -
 95
95 -
96
-
97
-
98
-
99
-
100
-
101
-
102
-
103
-
104
-
105
-
106
-
107
-
108
-
109
-
110
-
111
-
112
-
113
-
114
-
115
-
116
-
117
-
118
-
119
-
120
-
121
-
122
-
123
-
124
-
125
-
126
-
127
-
128
-
129
-
130
-
131
-
132
-
133
-
134
-
135
-
136
-
137
-
138
-
139
-
140
-
141
-
142
-
143
-
144
-
145
-
146
-
147
-
148
-
149
-
150
-
151
-
152
-
153
-
154
-
155
-
156
-
157
-
158
-
159
-
160
-
161
-
162
-
163
-
164
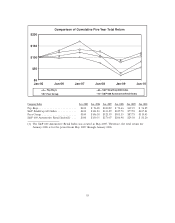
 |
 |

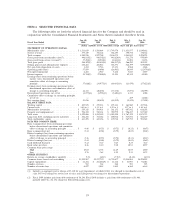
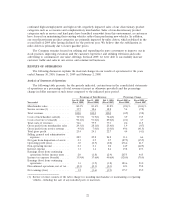
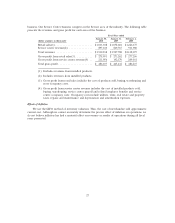
business. Our Service Center business competes in the Service area of the industry. The following table
presents the revenues and gross profit for each area of the business.
Fiscal Year ended
January 30, January 31, February 2,
(dollar amounts in thousands) 2010 2009 2008
Retail sales(1) ........................ $1,013,308 $1,058,021 $1,226,175
Service center revenue(2) ............... 897,630 869,767 911,900
Total revenues ....................... $1,910,938 $1,927,788 $2,138,075
Gross profit from retail sales(3) ........... $ 275,051 $ 273,262 $ 277,206
Gross profit from service center revenue(4) . . 211,056 192,170 209,031
Total gross profit ...................... $ 486,107 $ 465,432 $ 486,237
(1) Excludes revenues from installed products.
(2) Includes revenues from installed products.
(3) Gross profit from retail sales includes the cost of products sold, buying, warehousing and
store occupancy costs.
(4) Gross profit from service center revenue includes the cost of installed products sold,
buying, warehousing, service center payroll and related employee benefits and service
center occupancy costs. Occupancy costs include utilities, rents, real estate and property
taxes, repairs and maintenance and depreciation and amortization expenses.
Effects of Inflation
We use the LIFO method of inventory valuation. Thus, the cost of merchandise sold approximates
current cost. Although we cannot accurately determine the precise effect of inflation on operations, we
do not believe inflation has had a material effect on revenues or results of operations during all fiscal
years presented.
27