Pep Boys 2009 Annual Report Download - page 131
Download and view the complete annual report
Please find page 131 of the 2009 Pep Boys annual report below. You can navigate through the pages in the report by either clicking on the pages listed below, or by using the keyword search tool below to find specific information within the annual report.-
 1
1 -
2
-
3
-
4
-
5
-
6
-
7
-
8
-
9
-
10
-
11
-
12
-
13
-
14
-
15
-
16
-
17
-
18
-
19
-
20
-
21
-
22
-
23
-
24
-
25
-
26
-
27
-
28
-
29
-
30
-
31
-
32
-
33
-
34
-
35
-
36
-
37
-
38
-
39
-
40
-
41
-
42
-
43
-
44
-
45
-
46
-
47
-
48
-
49
-
50
-
51
-
52
-
53
-
54
-
55
-
56
-
57
-
58
-
59
-
60
-
61
-
62
-
63
-
64
-
65
-
66
-
67
-
68
-
69
-
70
-
71
-
72
-
73
-
74
-
75
-
76
-
77
-
78
-
79
-
80
-
81
-
82
-
83
-
84
-
85
-
86
-
87
-
88
-
89
-
90
-
91
-
92
-
93
-
94
-
95
-
96
-
97
-
98
-
99
-
100
-
101
-
102
-
103
-
104
-
105
-
106
-
107
-
108
-
109
-
110
-
111
-
112
-
113
-
114
-
115
-
116
-
117
-
118
-
119
-
120
-
 121
121 -
 122
122 -
 123
123 -
 124
124 -
 125
125 -
 126
126 -
 127
127 -
 128
128 -
 129
129 -
 130
130 -
 131
131 -
 132
132 -
 133
133 -
 134
134 -
 135
135 -
 136
136 -
 137
137 -
 138
138 -
 139
139 -
 140
140 -
 141
141 -
142
-
143
-
144
-
145
-
146
-
147
-
148
-
149
-
150
-
151
-
152
-
153
-
154
-
155
-
156
-
157
-
158
-
159
-
160
-
161
-
162
-
163
-
164
 |
 |

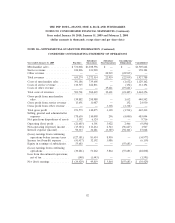
THE PEP BOYS—MANNY, MOE & JACK AND SUBSIDIARIES
NOTES TO CONSOLIDATED FINANCIAL STATEMENTS (Continued)
Years ended January 30, 2010, January 31, 2009 and February 2, 2008
(dollar amounts in thousands, except share and per share data)
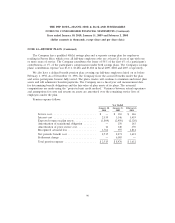
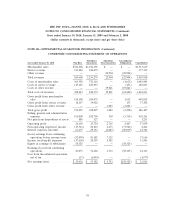
NOTE 15—EQUITY COMPENSATION PLANS (Continued)
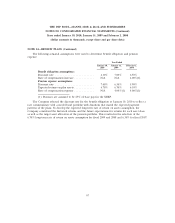
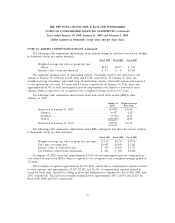
The following table summarizes information about options during the last three fiscal years (dollars
in thousands except per option amount):
Fiscal 2009 Fiscal 2008 Fiscal 2007
Weighted average fair value at grant date per
option .............................. $2.10 $3.47 $ 5.04
Intrinsic value of options exercised ........... $ 43 $ 8 $2,194
The aggregate intrinsic value of outstanding options, exercisable options and expected to vest
options at January 30, 2010 was $4,128, $284 and $3,528, respectively. At January 30, 2010, the
weighted average remaining contractual term of outstanding options, exercisable options and expected
to vest options was 4.8 years, 2.5 years and 5.9 years, respectively. At January 30, 2010, there was
approximately $1,592 of total unrecognized pre-tax compensation cost related to non-vested stock
options, which is expected to be recognized over a weighted average period of 1.5 years.
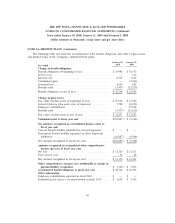
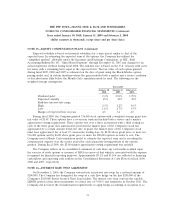
The following table summarizes information about non-vested stock awards (RSUs) since
January 31, 2009:
Number of Weighted Average
RSUs Fair Value
Nonvested at January 31, 2009 .................... 319,009 $13.66
Granted .................................. 30,927 9.18
Forfeited .................................. (8,754) 14.42
Vested ................................... (108,589) 14.04
Nonvested at January 30, 2010 .................... 232,593 $13.76
The following table summarizes information about RSUs during the last three fiscal years (dollars
in thousands except per unit amounts):
Fiscal 2009 Fiscal 2008 Fiscal 2007
Weighted average fair value at grant date per unit $ 9.18 $11.25 $15.56
Fair value at vesting date .................. $1,455 $5,441 $3,341
Intrinsic value at conversion date ............. $ 675 $1,586 $3,773
Tax benefits realized from conversions ......... $ 251 $ 589 $1,402
At January 30, 2010, there was approximately $1,510 of total unrecognized pre-tax compensation
cost related to non-vested RSUs, which is expected to be recognized over a weighted-average period of
1.2 years.
The Company recognized approximately $1,010, $641, and $3,060 of compensation expense related
to stock options, and approximately $1,565, $2,102, and $6,696 of compensation expense related to
restricted stock units, included in selling, general and administrative expenses for fiscal 2009, 2008, and
2007, respectively. The related tax benefit recognized was approximately $957, $1,019 and $3,624 for
fiscal 2009, 2008 and 2007, respectively.
73