Pep Boys 2009 Annual Report Download - page 60
Download and view the complete annual report
Please find page 60 of the 2009 Pep Boys annual report below. You can navigate through the pages in the report by either clicking on the pages listed below, or by using the keyword search tool below to find specific information within the annual report.-
 1
1 -
2
-
3
-
4
-
5
-
6
-
7
-
8
-
9
-
10
-
11
-
12
-
13
-
14
-
15
-
16
-
17
-
18
-
19
-
20
-
21
-
22
-
23
-
24
-
25
-
26
-
27
-
28
-
29
-
30
-
31
-
32
-
33
-
34
-
35
-
36
-
37
-
38
-
39
-
40
-
41
-
42
-
43
-
44
-
45
-
46
-
47
-
48
-
49
-
 50
50 -
 51
51 -
 52
52 -
 53
53 -
 54
54 -
 55
55 -
 56
56 -
 57
57 -
 58
58 -
 59
59 -
 60
60 -
 61
61 -
 62
62 -
 63
63 -
 64
64 -
 65
65 -
 66
66 -
 67
67 -
 68
68 -
 69
69 -
 70
70 -
71
-
72
-
73
-
74
-
75
-
76
-
77
-
78
-
79
-
80
-
81
-
82
-
83
-
84
-
85
-
86
-
87
-
88
-
89
-
90
-
91
-
92
-
93
-
94
-
95
-
96
-
97
-
98
-
99
-
100
-
101
-
102
-
103
-
104
-
105
-
106
-
107
-
108
-
109
-
110
-
111
-
112
-
113
-
114
-
115
-
116
-
117
-
118
-
119
-
120
-
121
-
122
-
123
-
124
-
125
-
126
-
127
-
128
-
129
-
130
-
131
-
132
-
133
-
134
-
135
-
136
-
137
-
138
-
139
-
140
-
141
-
142
-
143
-
144
-
145
-
146
-
147
-
148
-
149
-
150
-
151
-
152
-
153
-
154
-
155
-
156
-
157
-
158
-
159
-
160
-
161
-
162
-
163
-
164
 |
 |

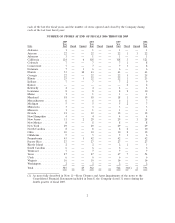
each of the last five fiscal years, and the number of stores opened and closed by the Company during
each of the last four fiscal years:
NUMBER OF STORES AT END OF FISCALS 2006 THROUGH 2009
2009 2008 2007 2006
Year Year Year Year
State End Closed Opened End Closed Opened End Closed Opened End
Alabama .............. 1 — — 1 — — 1 — — 1
Arizona .............. 22 — — 22 — — 22 1 1 22
Arkansas ............. 1 — — 1 — — 1 — — 1
California ............. 124 — 6 118 — — 118 3 — 121
Colorado ............. 7 — — 7 — — 7 1 — 8
Connecticut ........... 7 — — 7 — — 7 1 — 8
Delaware ............. 7 — 1 6 — — 6 — — 6
Florida ............... 53 — 10 43 — — 43 — — 43
Georgia .............. 22 — — 22 — — 22 3 — 25
Illinois ............... 25 — 3 22 — — 22 1 — 23
Indiana ............... 7 — — 7 — — 7 2 — 9
Kansas ............... — — — — — — — 2 — 2
Kentucky ............. 4 — — 4 — — 4 — — 4
Louisiana ............. 8 — — 8 — — 8 2 — 10
Maine ............... 1 — — 1 — — 1 — — 1
Maryland ............. 18 — — 18 — — 18 1 — 19
Massachusetts .......... 6 — — 6 — — 6 1 — 7
Michigan ............. 5 — — 5 — — 5 2 — 7
Minnesota ............ 3 — — 3 — — 3 — — 3
Missouri .............. 1 — — 1 — — 1 — — 1
Nevada ............... 12 — — 12 — — 12 — — 12
New Hampshire ........ 4 — — 4 — — 4 — — 4
New Jersey ............ 31 — 2 29 — — 29 — 1 28
New Mexico ........... 8 — — 8 — — 8 — — 8
New York ............. 29 — — 29 — — 29 — — 29
North Carolina ......... 8 — — 8 — — 8 2 — 10
Ohio ................ 10 — — 10 — — 10 2 — 12
Oklahoma ............. 5 — — 5 — — 5 1 — 6
Pennsylvania ........... 45 — 3 42 — — 42 — — 42
Puerto Rico ........... 27 — — 27 — — 27 — — 27
Rhode Island .......... 2 — — 2 — — 2 1 — 3
South Carolina ......... 6 — — 6 — — 6 — — 6
Tennessee ............. 7 — — 7 — — 7 — — 7
Texas ................ 47 — — 47 — — 47 7 — 54
Utah ................ 6 — — 6 — — 6 — — 6
Virginia .............. 16 — — 16 — — 16 — — 16
Washington ............ 2 — — 2 — — 2 — — 2
Total ................ 587 — 25 562 — — 562 33(1) 2 593
(1) As more fully described in Note 11—Store Closures and Asset Impairments of the notes to the
Consolidated Financial Statements included in Item 8, the Company closed 31 stores during the
fourth quarter of fiscal 2007.
2