Pep Boys 2009 Annual Report Download - page 129
Download and view the complete annual report
Please find page 129 of the 2009 Pep Boys annual report below. You can navigate through the pages in the report by either clicking on the pages listed below, or by using the keyword search tool below to find specific information within the annual report.-
 1
1 -
2
-
3
-
4
-
5
-
6
-
7
-
8
-
9
-
10
-
11
-
12
-
13
-
14
-
15
-
16
-
17
-
18
-
19
-
20
-
21
-
22
-
23
-
24
-
25
-
26
-
27
-
28
-
29
-
30
-
31
-
32
-
33
-
34
-
35
-
36
-
37
-
38
-
39
-
40
-
41
-
42
-
43
-
44
-
45
-
46
-
47
-
48
-
49
-
50
-
51
-
52
-
53
-
54
-
55
-
56
-
57
-
58
-
59
-
60
-
61
-
62
-
63
-
64
-
65
-
66
-
67
-
68
-
69
-
70
-
71
-
72
-
73
-
74
-
75
-
76
-
77
-
78
-
79
-
80
-
81
-
82
-
83
-
84
-
85
-
86
-
87
-
88
-
89
-
90
-
91
-
92
-
93
-
94
-
95
-
96
-
97
-
98
-
99
-
100
-
101
-
102
-
103
-
104
-
105
-
106
-
107
-
108
-
109
-
110
-
111
-
112
-
113
-
114
-
115
-
116
-
117
-
118
-
 119
119 -
 120
120 -
 121
121 -
 122
122 -
 123
123 -
 124
124 -
 125
125 -
 126
126 -
 127
127 -
 128
128 -
 129
129 -
 130
130 -
 131
131 -
 132
132 -
 133
133 -
 134
134 -
 135
135 -
 136
136 -
 137
137 -
 138
138 -
 139
139 -
140
-
141
-
142
-
143
-
144
-
145
-
146
-
147
-
148
-
149
-
150
-
151
-
152
-
153
-
154
-
155
-
156
-
157
-
158
-
159
-
160
-
161
-
162
-
163
-
164
 |
 |

THE PEP BOYS—MANNY, MOE & JACK AND SUBSIDIARIES
NOTES TO CONSOLIDATED FINANCIAL STATEMENTS (Continued)
Years ended January 30, 2010, January 31, 2009 and February 2, 2008
(dollar amounts in thousands, except share and per share data)
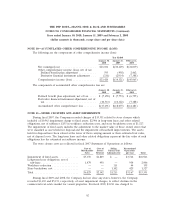
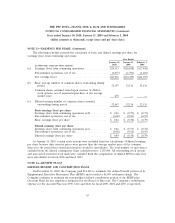
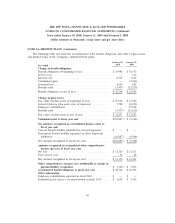
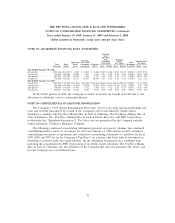
NOTE 14—BENEFIT PLANS (Continued)
publicly traded. The underlying assets in these funds (equity securities and fixed income securities) are
publicly traded on exchanges and price quotes for the assets held by these funds are readily available.
CTs are valued at their net asset values (NAVs) that are calculated by the investment manager of the
fund and have daily or monthly liquidity. These investments are classified within Level 2 of the fair
value hierarchy.
Guaranteed annuity contracts (GACs) are annuity insurance contracts. GACs are primarily
invested in public bonds with some small placement in common stock, private placement bonds and
commercial mortgage products. The GACs are valued based on unobservable inputs, as observable
inputs are not available, using valuation methodologies to determine fair value. GACs are deemed to
be Level 3 investments.
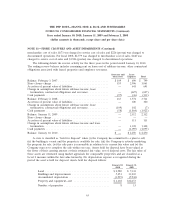
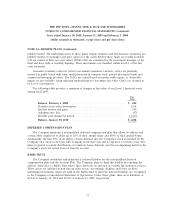
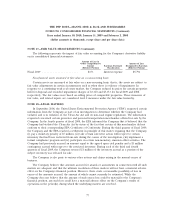
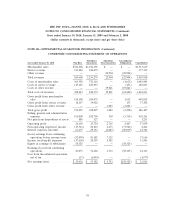
The following table provides a summary of changes in fair value of our Level 3 financial assets
during fiscal 2009:
Fair
Value
Balance, February 1, 2009 ................................... $ 884
Transfers from other investments .............................. 1,558
Interest income and gains .................................... 240
Administrative fees ........................................ (57)
Benefits paid during the period ................................ (1,417)
Balance, January 30, 2010 ................................... $ 1,208
DEFERRED COMPENSATION PLAN
The Company maintains a non-qualified deferred compensation plan that allows its officers and
certain other employees to defer up to 20% of their annual salary and 100% of their annual bonus.
Additionally, the first 20% of an officer’s bonus deferred into the Company’s stock is matched by the
Company on a one-for-one basis with Company stock that vests and is expensed over three years. The
shares required to satisfy distributions of voluntary bonus deferrals and the accompanying match in the
Company’s stock are issued from its treasury account.
RABBI TRUST
The Company establishes and maintains a deferred liability for the non-qualified deferred
compensation plan and the Account Plan. The Company plans to fund this liability by remitting the
officers’ deferrals to a Rabbi Trust where these deferrals are invested in variable life insurance policies.
These assets are included in non-current other assets. Accordingly, all gains and losses on these
underlying investments, which are held in the Rabbi Trust to fund the deferred liability, are recognized
in the Company’s Consolidated Statement of Operations. Under these plans, there were liabilities of
$3,440 at January 30, 2010 and $2,699 at January 31, 2009, respectively.
71