Pep Boys 2009 Annual Report Download - page 29
Download and view the complete annual report
Please find page 29 of the 2009 Pep Boys annual report below. You can navigate through the pages in the report by either clicking on the pages listed below, or by using the keyword search tool below to find specific information within the annual report.-
 1
1 -
2
-
3
-
4
-
5
-
6
-
7
-
8
-
9
-
10
-
11
-
12
-
13
-
14
-
15
-
16
-
17
-
18
-
 19
19 -
 20
20 -
 21
21 -
 22
22 -
 23
23 -
 24
24 -
 25
25 -
 26
26 -
 27
27 -
 28
28 -
 29
29 -
 30
30 -
 31
31 -
 32
32 -
 33
33 -
 34
34 -
 35
35 -
 36
36 -
 37
37 -
 38
38 -
 39
39 -
40
-
41
-
42
-
43
-
44
-
45
-
46
-
47
-
48
-
49
-
50
-
51
-
52
-
53
-
54
-
55
-
56
-
57
-
58
-
59
-
60
-
61
-
62
-
63
-
64
-
65
-
66
-
67
-
68
-
69
-
70
-
71
-
72
-
73
-
74
-
75
-
76
-
77
-
78
-
79
-
80
-
81
-
82
-
83
-
84
-
85
-
86
-
87
-
88
-
89
-
90
-
91
-
92
-
93
-
94
-
95
-
96
-
97
-
98
-
99
-
100
-
101
-
102
-
103
-
104
-
105
-
106
-
107
-
108
-
109
-
110
-
111
-
112
-
113
-
114
-
115
-
116
-
117
-
118
-
119
-
120
-
121
-
122
-
123
-
124
-
125
-
126
-
127
-
128
-
129
-
130
-
131
-
132
-
133
-
134
-
135
-
136
-
137
-
138
-
139
-
140
-
141
-
142
-
143
-
144
-
145
-
146
-
147
-
148
-
149
-
150
-
151
-
152
-
153
-
154
-
155
-
156
-
157
-
158
-
159
-
160
-
161
-
162
-
163
-
164
 |
 |

23
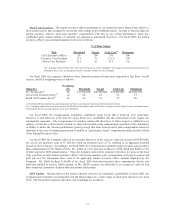
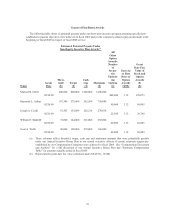
Grants of Plan Based Awards
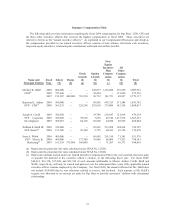
The following table shows (i) potential payouts under our short-term incentive program assuming specified pre-
established corporate objectives were achieved in fiscal 2009 and (ii) the customary annual equity grants made at the
beginning of fiscal 2009 in respect of fiscal 2008 service.
Estimated Potential Payouts Under
Non-Equity Incentive Plan Awards(a)
Name
Grant
Date
Thres-
hold
($)
Target
($)
Cash
Cap
($)
Maximum
($)
All
Other
Option
Awards:
Number
of
Securi-
ties
Underly-
ing
Options
(#)
Exercise
or Base
Price of
Option
Awards
($/Sh)
Grant
Date Fair
Value of
Stock and
Option
Awards
($)
(b)
Michael R. Odell 400,000 800,000
1,200,000
1,600,000
02/26/09
400,000 3.12 670,073
Raymond L. Arthur 187,500 375,000
562,500
750,000
02/26/09
40,000 3.12 68,885
Joseph A. Cirelli 67,505 135,009
202,514
270,018
02/26/09
22,500 3.12 38,748
William E. Shull III 72,000 144,000
216,000
288,000
02/26/09
40,000 3.12 68,885
Scott A. Webb 90,000 180,000
270,000
360,000
02/26/09
40,000 3.12 68,885
(a) These columns reflect threshold, target, cash cap and maximum amounts that were potentially payable
under our Annual Incentive Bonus Plan to our named executive officers if certain corporate targets pre-
established by our Compensation Committee were achieved in fiscal 2009. See “Compensation Discussion
and Analysis” for a full discussion of our Annual Incentive Bonus Plan and “Summary Compensation
Table” for amounts actually earned in fiscal 2009.
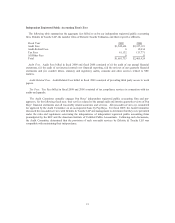
(b) Represents the grant-date fair value calculated under SFAS No. 123(R).