Pep Boys 2009 Annual Report Download - page 80
Download and view the complete annual report
Please find page 80 of the 2009 Pep Boys annual report below. You can navigate through the pages in the report by either clicking on the pages listed below, or by using the keyword search tool below to find specific information within the annual report.-
 1
1 -
2
-
3
-
4
-
5
-
6
-
7
-
8
-
9
-
10
-
11
-
12
-
13
-
14
-
15
-
16
-
17
-
18
-
19
-
20
-
21
-
22
-
23
-
24
-
25
-
26
-
27
-
28
-
29
-
30
-
31
-
32
-
33
-
34
-
35
-
36
-
37
-
38
-
39
-
40
-
41
-
42
-
43
-
44
-
45
-
46
-
47
-
48
-
49
-
50
-
51
-
52
-
53
-
54
-
55
-
56
-
57
-
58
-
59
-
60
-
61
-
62
-
63
-
64
-
65
-
66
-
67
-
68
-
69
-
 70
70 -
 71
71 -
 72
72 -
 73
73 -
 74
74 -
 75
75 -
 76
76 -
 77
77 -
 78
78 -
 79
79 -
 80
80 -
 81
81 -
 82
82 -
 83
83 -
 84
84 -
 85
85 -
 86
86 -
 87
87 -
 88
88 -
 89
89 -
 90
90 -
91
-
92
-
93
-
94
-
95
-
96
-
97
-
98
-
99
-
100
-
101
-
102
-
103
-
104
-
105
-
106
-
107
-
108
-
109
-
110
-
111
-
112
-
113
-
114
-
115
-
116
-
117
-
118
-
119
-
120
-
121
-
122
-
123
-
124
-
125
-
126
-
127
-
128
-
129
-
130
-
131
-
132
-
133
-
134
-
135
-
136
-
137
-
138
-
139
-
140
-
141
-
142
-
143
-
144
-
145
-
146
-
147
-
148
-
149
-
150
-
151
-
152
-
153
-
154
-
155
-
156
-
157
-
158
-
159
-
160
-
161
-
162
-
163
-
164
 |
 |

continued high unemployment and tight credit, negatively impacted sales of our discretionary product
categories such as accessories and complementary merchandise. Sales of non-discretionary product
categories such as service and hard parts have benefited somewhat from this environment, as customers
have focused on maintaining their existing vehicles rather than purchasing new vehicles. In addition,
our non-discretionary product categories are primarily impacted by miles driven, which stabilized in the
second half of 2009 after having declined for the previous year. We believe that the stabilization in
miles driven is primarily due to lower gasoline prices.
The Company remains focused on refining and expanding the parts assortment to improve our in
stock position, improving execution and the customer experience and utilizing television and radio
advertising to communicate our value offerings. In fiscal 2009, we were able to successfully increase
customer traffic and sales in our service and commercial businesses.
RESULTS OF OPERATIONS
The following discussion explains the material changes in our results of operations for the years
ended January 30, 2010, January 31, 2009 and February 2, 2008.
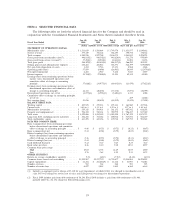
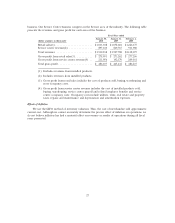
Analysis of Statement of Operations
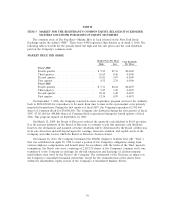
The following table presents, for the periods indicated, certain items in the consolidated statements
of operations as a percentage of total revenues (except as otherwise provided) and the percentage
change in dollar amounts of such items compared to the indicated prior period.
Percentage of Total Revenues Percentage Change
Jan 30, 2010 Jan 31, 2009 Feb 2, 2008 Fiscal 2009 vs. Fiscal 2008 vs.
Year ended (Fiscal 2009) (Fiscal 2008) (Fiscal 2007) Fiscal 2008 Fiscal 2007
Merchandise sales .............. 80.3% 81.4% 81.8% (2.3)% (10.3)%
Service revenue(1) ............. 19.7 18.6 18.2 5.4 (7.8)
Total revenues ................ 100.0 100.0 100.0 (0.9) (9.8)
Costs of merchandise sales(2) ...... 70.7(3) 71.9(3) 74.6(3) 3.9 13.5
Costs of service revenue(2) ....... 90.1(3) 93.0(3) 89.0(3) (2.1) 3.7
Total costs of revenues .......... 74.6 75.9 77.3 2.6 11.5
Gross profit from merchandise sales . 29.3(3) 28.1(3) 25.4(3) 1.9 (0.7)
Gross profit from service revenue . . . 9.9(3) 7.0(3) 11.0(3) 49.6 (41.5)
Total gross profit ............... 25.4 24.1 22.7 4.4 (4.3)
Selling, general and administrative
expenses ................... 22.5 25.2 24.2 11.3 6.4
Net gain from disposition of assets . . 0.1 0.5 0.7 (87.5) (35.9)
Operating profit (loss) ........... 3.0 (0.5) (0.8) 676.6 41.7
Non-operating income ........... 0.1 0.1 0.2 14.9 (62.5)
Interest expense ............... 1.1 1.4 2.4 19.8 47.3
Earnings (loss) from continuing
operations before income taxes . . . 2.0 (1.8) (2.9) 207.5 44.5
Income tax expense (benefit) ...... 35.9(4) 17.6(4) 40.6(4) (320.0) (76.0)
Earnings (loss) from continuing
operations .................. 1.3 (1.5) (1.8) 183.6 23.0
Discontinued operations, net of tax . . (0.1) (0.1) (0.1) 32.3 55.8
Net earnings (loss) ............. 1.2 (1.6) (1.9) 175.7 25.9
(1) Service revenue consists of the labor charge for installing merchandise or maintaining or repairing
vehicles, excluding the sale of any installed parts or materials.
22