Pep Boys 2009 Annual Report Download - page 79
Download and view the complete annual report
Please find page 79 of the 2009 Pep Boys annual report below. You can navigate through the pages in the report by either clicking on the pages listed below, or by using the keyword search tool below to find specific information within the annual report.-
 1
1 -
2
-
3
-
4
-
5
-
6
-
7
-
8
-
9
-
10
-
11
-
12
-
13
-
14
-
15
-
16
-
17
-
18
-
19
-
20
-
21
-
22
-
23
-
24
-
25
-
26
-
27
-
28
-
29
-
30
-
31
-
32
-
33
-
34
-
35
-
36
-
37
-
38
-
39
-
40
-
41
-
42
-
43
-
44
-
45
-
46
-
47
-
48
-
49
-
50
-
51
-
52
-
53
-
54
-
55
-
56
-
57
-
58
-
59
-
60
-
61
-
62
-
63
-
64
-
65
-
66
-
67
-
68
-
 69
69 -
 70
70 -
 71
71 -
 72
72 -
 73
73 -
 74
74 -
 75
75 -
 76
76 -
 77
77 -
 78
78 -
 79
79 -
 80
80 -
 81
81 -
 82
82 -
 83
83 -
 84
84 -
 85
85 -
 86
86 -
 87
87 -
 88
88 -
 89
89 -
90
-
91
-
92
-
93
-
94
-
95
-
96
-
97
-
98
-
99
-
100
-
101
-
102
-
103
-
104
-
105
-
106
-
107
-
108
-
109
-
110
-
111
-
112
-
113
-
114
-
115
-
116
-
117
-
118
-
119
-
120
-
121
-
122
-
123
-
124
-
125
-
126
-
127
-
128
-
129
-
130
-
131
-
132
-
133
-
134
-
135
-
136
-
137
-
138
-
139
-
140
-
141
-
142
-
143
-
144
-
145
-
146
-
147
-
148
-
149
-
150
-
151
-
152
-
153
-
154
-
155
-
156
-
157
-
158
-
159
-
160
-
161
-
162
-
163
-
164
 |
 |
ITEM 7 MANAGEMENT’S DISCUSSION AND ANALYSIS OF FINANCIAL CONDITION AND
RESULTS OF OPERATIONS
OVERVIEW
The following discussion and analysis explains the results of our operations for fiscal 2009 and
2008 and significant developments affecting our financial condition as of January 30, 2010. This
discussion and analysis below should be read in conjunction with Item 6 ‘‘Selected Consolidated
Financial Data,’’ and our consolidated financial statements and the notes included elsewhere in this
report. The discussion and analysis contains ‘‘forward looking statements’’ within the meaning of The
Private Securities Litigation Reform Act of 1995. Forward looking statements include management’s
expectations regarding implementation of its long-term strategic plan, future financial performance,
automotive aftermarket trends, levels of competition, business development activities, future capital
expenditures, financing sources and availability and the effects of regulation and litigation. Actual
results may differ materially from the results discussed in the forward looking statements due to a
number of factors beyond our control, including those set forth under the section entitled ‘‘Item 1A
Risk Factors’’ elsewhere in this report.
Introduction
The Pep Boys-Manny, Moe & Jack is the only national chain offering automotive service, tires,
parts and accessories. This positioning allows us to streamline the distribution channel and pass the
savings to the customer facilitating our vision of becoming the automotive solutions provider of choice
for the value-oriented customer. The majority of our stores are in a Supercenter format, which serves
both ‘‘do-it-for-me’’ (‘‘DIFM’’, which includes service labor, installed merchandise and tires) and
‘‘do-it-yourself’’ (‘‘DIY’’, or retail) customers with the highest quality service offerings and merchandise.
Most of our Supercenters also have a commercial sales program that provides delivery of tires, parts
and other products to automotive repair shops and dealers. In 2009, as part of our long-term strategy
to lead with automotive service, we began complementing our existing Supercenter store base with
Service & Tire Centers. These Service & Tire Centers are designed to capture market share and
leverage our existing Supercenter and support infrastructure. During fiscal 2009, we opened 24 new
Service & Tire Centers, including ten locations acquired through our purchase of the assets of Florida
Tire, Inc., and opened one new prototype Supercenter. We are targeting a total of 40 new Service &
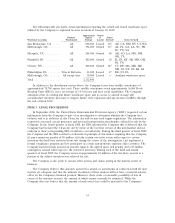
Tire Centers in fiscal 2010 and 80 in fiscal 2011. As of January 30, 2010, we operated 553 Supercenters
and 25 Service & Tire Centers, as well as nine legacy Pep Express (retail only) stores throughout 35
states and Puerto Rico.
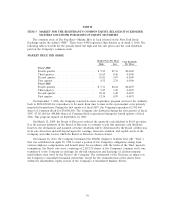
EXECUTIVE SUMMARY
During fiscal 2009, the Company continued to focus on executing its long-term strategic plan and
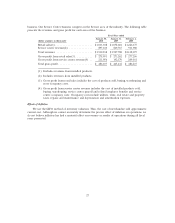
reported its first profitable year since fiscal 2004. For fiscal 2009, earnings from continuing operations
before taxes increased by $72,593,000 to $37,616,000, compared to a loss from continuing operations
before taxes of $34,977,000 in the prior year. Net earnings for fiscal 2009 increased by $53,465,000 to
$23,036,000, compared to a net loss of $30,429,000 in the prior year. Our increase in profitability
resulted primarily from increased service revenues, increased gross profit margins and lower selling,
general and administrative expenses due to continued disciplined spending control. Our diluted
earnings per share for fiscal 2009 was $0.44, a $1.02 improvement over the $0.58 loss per diluted share
recorded in fiscal 2008 (see Results of Operations).
For fiscal 2009, our comparable sales (sales generated by locations in operation during the same
period of the prior year) decreased by 1.2% compared to a decrease of 8.0% in the prior year. The
decrease in comparable sales was comprised of a 4.7% increase in comparable service revenue and a
2.6% decrease in comparable merchandise sales. The difficult macroeconomic environment, including
21