Pep Boys 2009 Annual Report Download - page 128
Download and view the complete annual report
Please find page 128 of the 2009 Pep Boys annual report below. You can navigate through the pages in the report by either clicking on the pages listed below, or by using the keyword search tool below to find specific information within the annual report.-
 1
1 -
2
-
3
-
4
-
5
-
6
-
7
-
8
-
9
-
10
-
11
-
12
-
13
-
14
-
15
-
16
-
17
-
18
-
19
-
20
-
21
-
22
-
23
-
24
-
25
-
26
-
27
-
28
-
29
-
30
-
31
-
32
-
33
-
34
-
35
-
36
-
37
-
38
-
39
-
40
-
41
-
42
-
43
-
44
-
45
-
46
-
47
-
48
-
49
-
50
-
51
-
52
-
53
-
54
-
55
-
56
-
57
-
58
-
59
-
60
-
61
-
62
-
63
-
64
-
65
-
66
-
67
-
68
-
69
-
70
-
71
-
72
-
73
-
74
-
75
-
76
-
77
-
78
-
79
-
80
-
81
-
82
-
83
-
84
-
85
-
86
-
87
-
88
-
89
-
90
-
91
-
92
-
93
-
94
-
95
-
96
-
97
-
98
-
99
-
100
-
101
-
102
-
103
-
104
-
105
-
106
-
107
-
108
-
109
-
110
-
111
-
112
-
113
-
114
-
115
-
116
-
117
-
 118
118 -
 119
119 -
 120
120 -
 121
121 -
 122
122 -
 123
123 -
 124
124 -
 125
125 -
 126
126 -
 127
127 -
 128
128 -
 129
129 -
 130
130 -
 131
131 -
 132
132 -
 133
133 -
 134
134 -
 135
135 -
 136
136 -
 137
137 -
 138
138 -
139
-
140
-
141
-
142
-
143
-
144
-
145
-
146
-
147
-
148
-
149
-
150
-
151
-
152
-
153
-
154
-
155
-
156
-
157
-
158
-
159
-
160
-
161
-
162
-
163
-
164
 |
 |

THE PEP BOYS—MANNY, MOE & JACK AND SUBSIDIARIES
NOTES TO CONSOLIDATED FINANCIAL STATEMENTS (Continued)
Years ended January 30, 2010, January 31, 2009 and February 2, 2008
(dollar amounts in thousands, except share and per share data)
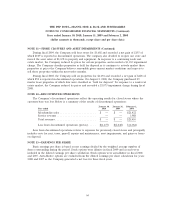
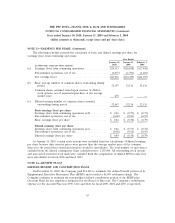
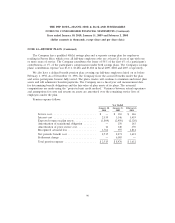
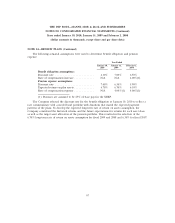
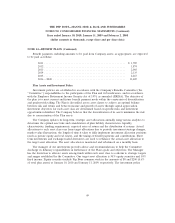
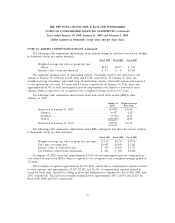
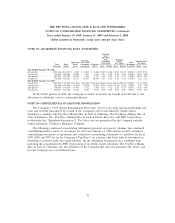
NOTE 14—BENEFIT PLANS (Continued)
requires that the asset allocation be maintained within certain ranges. The weighted average asset
allocations and asset allocation ranges by asset category are as follows:
Weighted Average Asset Allocations
January 30, January 31, Asset Allocation
2010 2009 Ranges
Total equities ..................................... 48% 44% 45 – 55%
Domestic equities ................................ 32% — 28 – 38%
Non-US equities ................................. 17% — 12 – 22%
Fixed income ..................................... 52% 56% 45 – 55%
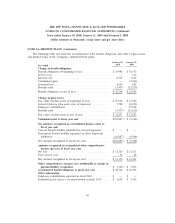
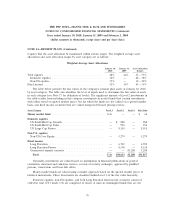
The table below provides the fair values of the company’s pension plan assets at January 30, 2010,
by asset category. The table also identifies the level of inputs used to determine the fair value of assets
in each category (see Note 17 for definition of levels). The significant amount of Level 2 investments in
the table results from including in this category, investments in pooled funds that contain investments
with values based on quoted market prices, but for which the funds are not valued on a quoted market
basis, and fixed income securities that are valued using model based pricing services.
Asset Category Level 1 Level 2 Level 3 Fair Value
Money market fund ................................. $36 — — $ 36
Domestic equities
US Small/Mid Cap Growth .......................... — $ 988 — 988
US Small/Mid Cap Value ............................ — 996 — 996
US Large Cap Passive .............................. — 8,110 — 8,110
Non-U.S. equities
Non-US Core Equity ............................... — 5,279 — 5,279
Fixed income
Long Duration ................................... — 6,702 — 6,702
Long Duration Passive ............................. — 8,538 — 8,538
Guaranteed annuity contracts ........................ — — $1,208 1,208
Total ......................................... $ 36 $30,613 $1,208 $31,857
Generally, investments are valued based on information in financial publications of general
circulation, statistical and valuation services, records of security exchanges, appraisal by qualified
persons, transactions and bona fide offers.
Money market funds are valued using a market approach based on the quoted market prices of
identical instruments. These investments are classified within Level 1 of the fair value hierarchy.
Domestic equities, non-US equities, and both Long Duration fixed income securities consist of
collective trust (CT) funds. CTs are comprised of shares or units in commingled funds that are not
70