Pep Boys 2009 Annual Report Download - page 105
Download and view the complete annual report
Please find page 105 of the 2009 Pep Boys annual report below. You can navigate through the pages in the report by either clicking on the pages listed below, or by using the keyword search tool below to find specific information within the annual report.-
 1
1 -
2
-
3
-
4
-
5
-
6
-
7
-
8
-
9
-
10
-
11
-
12
-
13
-
14
-
15
-
16
-
17
-
18
-
19
-
20
-
21
-
22
-
23
-
24
-
25
-
26
-
27
-
28
-
29
-
30
-
31
-
32
-
33
-
34
-
35
-
36
-
37
-
38
-
39
-
40
-
41
-
42
-
43
-
44
-
45
-
46
-
47
-
48
-
49
-
50
-
51
-
52
-
53
-
54
-
55
-
56
-
57
-
58
-
59
-
60
-
61
-
62
-
63
-
64
-
65
-
66
-
67
-
68
-
69
-
70
-
71
-
72
-
73
-
74
-
75
-
76
-
77
-
78
-
79
-
80
-
81
-
82
-
83
-
84
-
85
-
86
-
87
-
88
-
89
-
90
-
91
-
92
-
93
-
94
-
 95
95 -
 96
96 -
 97
97 -
 98
98 -
 99
99 -
 100
100 -
 101
101 -
 102
102 -
 103
103 -
 104
104 -
 105
105 -
 106
106 -
 107
107 -
 108
108 -
 109
109 -
 110
110 -
 111
111 -
 112
112 -
 113
113 -
 114
114 -
 115
115 -
116
-
117
-
118
-
119
-
120
-
121
-
122
-
123
-
124
-
125
-
126
-
127
-
128
-
129
-
130
-
131
-
132
-
133
-
134
-
135
-
136
-
137
-
138
-
139
-
140
-
141
-
142
-
143
-
144
-
145
-
146
-
147
-
148
-
149
-
150
-
151
-
152
-
153
-
154
-
155
-
156
-
157
-
158
-
159
-
160
-
161
-
162
-
163
-
164
 |
 |
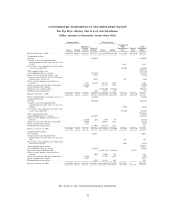
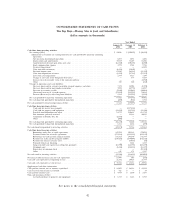
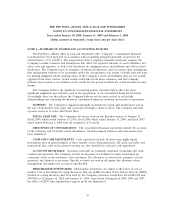
THE PEP BOYS—MANNY, MOE & JACK AND SUBSIDIARIES
NOTES TO CONSOLIDATED FINANCIAL STATEMENTS (Continued)
Years ended January 30, 2010, January 31, 2009 and February 2, 2008
(dollar amounts in thousands, except share and per share data)
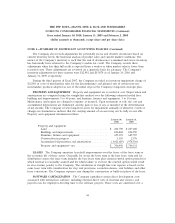
NOTE 1—SUMMARY OF SIGNIFICANT ACCOUNTING POLICIES (Continued)
ADVERTISING The Company expenses the costs of advertising the first time the advertising
takes place. Gross advertising expense for fiscal 2009, 2008 and 2007 was $52,565, $73,700 and $78,475,
respectively. No advertising costs were recorded as assets as of January 30, 2010 or January 31, 2009.
STORE OPENING COSTS The costs of opening new stores are expensed as incurred.
IMPAIRMENT OF LONG-LIVED ASSETS The Company evaluates the ability to recover
long-lived assets whenever events or circumstances indicate that the carrying value of the asset may not
be recoverable. In the event assets are impaired, losses are recognized to the extent the carrying value
exceeds fair value. In addition, the Company reports assets to be disposed of at the lower of the
carrying amount or the fair market value less selling costs. See discussion of current year impairments
in Note 11, ‘‘Store Closures and Asset Impairments.’’
EARNINGS PER SHARE Basic earnings per share are computed by dividing earnings by the
weighted average number of common shares outstanding during the year. Diluted earnings per share
are computed by dividing earnings by the weighted average number of common shares outstanding
during the year plus incremental shares that would have been outstanding upon the assumed exercise
of dilutive stock options.
ACCOUNTING FOR STOCK-BASED COMPENSATION At January 30, 2010, the Company has
two stock-based employee compensation plans, which are described in Note 15, ‘‘Equity Compensation
Plans.’’ Compensation costs relating to share-based payment transactions are recognized in the financial
statements. The cost is measured at the grant date, based on the calculated fair value of the award, and
is recognized as an expense over the employee’s requisite service period (generally the vesting period of
the equity award).
COMPREHENSIVE LOSS Other comprehensive loss includes pension liability and fair market
value of cash flow hedges.
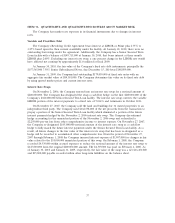
DERIVATIVE INSTRUMENTS AND HEDGING ACTIVITIES The Company may enter into
interest rate swap agreements to hedge the exposure to increasing rates with respect to its certain
variable rate debt agreements. The Company recognizes all derivatives as either assets or liabilities in
the statement of financial position and measures those instruments at fair value.
SEGMENT INFORMATION The Company operates in one industry, the automotive aftermarket,
principally using a Supercenter layout which houses both retail and service centers in one building. The
Company has six operating segments defined by geographic regions which are Northeast, Mid-Atlantic,
Southeast, Central, West and Southern CA. Each segment serves both our DIY and our DIFM lines of
47