Pep Boys 2009 Annual Report Download - page 97
Download and view the complete annual report
Please find page 97 of the 2009 Pep Boys annual report below. You can navigate through the pages in the report by either clicking on the pages listed below, or by using the keyword search tool below to find specific information within the annual report.-
 1
1 -
2
-
3
-
4
-
5
-
6
-
7
-
8
-
9
-
10
-
11
-
12
-
13
-
14
-
15
-
16
-
17
-
18
-
19
-
20
-
21
-
22
-
23
-
24
-
25
-
26
-
27
-
28
-
29
-
30
-
31
-
32
-
33
-
34
-
35
-
36
-
37
-
38
-
39
-
40
-
41
-
42
-
43
-
44
-
45
-
46
-
47
-
48
-
49
-
50
-
51
-
52
-
53
-
54
-
55
-
56
-
57
-
58
-
59
-
60
-
61
-
62
-
63
-
64
-
65
-
66
-
67
-
68
-
69
-
70
-
71
-
72
-
73
-
74
-
75
-
76
-
77
-
78
-
79
-
80
-
81
-
82
-
83
-
84
-
85
-
86
-
 87
87 -
 88
88 -
 89
89 -
 90
90 -
 91
91 -
 92
92 -
 93
93 -
 94
94 -
 95
95 -
 96
96 -
 97
97 -
 98
98 -
 99
99 -
 100
100 -
 101
101 -
 102
102 -
 103
103 -
 104
104 -
 105
105 -
 106
106 -
 107
107 -
108
-
109
-
110
-
111
-
112
-
113
-
114
-
115
-
116
-
117
-
118
-
119
-
120
-
121
-
122
-
123
-
124
-
125
-
126
-
127
-
128
-
129
-
130
-
131
-
132
-
133
-
134
-
135
-
136
-
137
-
138
-
139
-
140
-
141
-
142
-
143
-
144
-
145
-
146
-
147
-
148
-
149
-
150
-
151
-
152
-
153
-
154
-
155
-
156
-
157
-
158
-
159
-
160
-
161
-
162
-
163
-
164
 |
 |

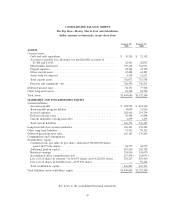
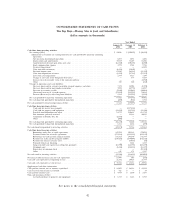
CONSOLIDATED BALANCE SHEETS
The Pep Boys—Manny, Moe & Jack and Subsidiaries
(dollar amounts in thousands, except share data)
January 30, January 31,
2010 2009
ASSETS
Current assets:
Cash and cash equivalents .................................... $ 39,326 $ 21,332
Accounts receivable, less allowance for uncollectible accounts of
$1,488 and $1,912 ........................................ 22,983 28,831
Merchandise inventories ..................................... 559,118 564,931
Prepaid expenses ........................................... 24,784 25,390
Other current assets ........................................ 65,428 62,421
Assets held for disposal ...................................... 4,438 12,653
Total current assets ......................................... 716,077 715,558
Property and equipment—net .................................. 706,450 740,331
Deferred income taxes ........................................ 58,171 77,708
Other long-term assets ........................................ 18,388 18,792
Total assets ................................................. $1,499,086 $1,552,389
LIABILITIES AND STOCKHOLDERS’ EQUITY
Current liabilities:
Accounts payable .......................................... $ 202,974 $ 212,340
Trade payable program liability ................................ 34,099 31,930
Accrued expenses .......................................... 242,416 254,754
Deferred income taxes ....................................... 29,984 35,848
Current maturities of long-term debt ............................ 1,079 1,453
Total current liabilities ....................................... 510,552 536,325
Long-term debt less current maturities ............................. 306,201 352,382
Other long-term liabilities ...................................... 73,933 70,322
Deferred gain from asset sales ................................... 165,105 170,204
Commitments and contingencies
Stockholders’ equity:
Common stock, par value $1 per share: authorized 500,000,000 shares;
issued 68,557,041 shares .................................... 68,557 68,557
Additional paid-in capital ..................................... 293,810 292,728
Retained earnings .......................................... 374,836 358,670
Accumulated other comprehensive loss ........................... (17,691) (18,075)
Less cost of shares in treasury—16,164,074 shares and 14,124,021 shares . . . 276,217 219,460
Less cost of shares in benefits trust—2,195,270 shares ................ — 59,264
Total stockholders’ equity ..................................... 443,295 423,156
Total liabilities and stockholders’ equity ............................ $1,499,086 $1,552,389
See notes to the consolidated financial statements
39