Pep Boys 2009 Annual Report Download - page 77
Download and view the complete annual report
Please find page 77 of the 2009 Pep Boys annual report below. You can navigate through the pages in the report by either clicking on the pages listed below, or by using the keyword search tool below to find specific information within the annual report.-
 1
1 -
2
-
3
-
4
-
5
-
6
-
7
-
8
-
9
-
10
-
11
-
12
-
13
-
14
-
15
-
16
-
17
-
18
-
19
-
20
-
21
-
22
-
23
-
24
-
25
-
26
-
27
-
28
-
29
-
30
-
31
-
32
-
33
-
34
-
35
-
36
-
37
-
38
-
39
-
40
-
41
-
42
-
43
-
44
-
45
-
46
-
47
-
48
-
49
-
50
-
51
-
52
-
53
-
54
-
55
-
56
-
57
-
58
-
59
-
60
-
61
-
62
-
63
-
64
-
65
-
66
-
 67
67 -
 68
68 -
 69
69 -
 70
70 -
 71
71 -
 72
72 -
 73
73 -
 74
74 -
 75
75 -
 76
76 -
 77
77 -
 78
78 -
 79
79 -
 80
80 -
 81
81 -
 82
82 -
 83
83 -
 84
84 -
 85
85 -
 86
86 -
 87
87 -
88
-
89
-
90
-
91
-
92
-
93
-
94
-
95
-
96
-
97
-
98
-
99
-
100
-
101
-
102
-
103
-
104
-
105
-
106
-
107
-
108
-
109
-
110
-
111
-
112
-
113
-
114
-
115
-
116
-
117
-
118
-
119
-
120
-
121
-
122
-
123
-
124
-
125
-
126
-
127
-
128
-
129
-
130
-
131
-
132
-
133
-
134
-
135
-
136
-
137
-
138
-
139
-
140
-
141
-
142
-
143
-
144
-
145
-
146
-
147
-
148
-
149
-
150
-
151
-
152
-
153
-
154
-
155
-
156
-
157
-
158
-
159
-
160
-
161
-
162
-
163
-
164
 |
 |

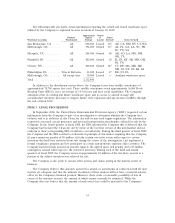
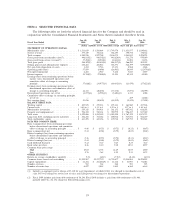
ITEM 6 SELECTED FINANCIAL DATA
The following tables set forth the selected financial data for the Company and should be read in
conjunction with the Consolidated Financial Statements and Notes thereto included elsewhere herein.
Jan. 30, Jan. 31, Feb. 2, Feb. 3, Jan. 28,
Fiscal Year Ended 2010 2009 2008 2007 2006
(dollar amounts are in thousands, except share and per share data)
STATEMENT OF OPERATIONS DATA(6)
Merchandise sales ...................... $1,533,619 $ 1,569,664 $ 1,749,578 $ 1,853,077 $ 1,830,632
Service revenue ........................ 377,319 358,124 388,497 390,778 378,342
Total revenues ........................ 1,910,938 1,927,788 2,138,075 2,243,855 2,208,974
Gross profit from merchandise sales(7) ......... 448,815(1) 440,502(3) 443,626(4) 533,276 470,019
Gross profit from service revenue(7) .......... 37,292(1) 24,930(3) 42,611(4) 33,004 32,276
Total gross profit ....................... 486,107(1) 465,432(3) 486,237(4) 566,280 502,295
Selling, general and administrative expenses ...... 430,261 485,044 518,373 546,399 519,600(5)
Net gain from disposition of assets ............ 1,213 9,716 15,151 8,968 4,826
Operating profit (loss) ................... 57,059 (9,896) (16,985) 28,849 (12,479)(5)
Non-operating income ................... 2,261 1,967 5,246 7,023 3,897
Interest expense ....................... 21,704(2) 27,048(2) 51,293 49,342 49,040
Earnings (loss) from continuing operations before
income taxes, discontinued operations and
cumulative effect of change in accounting
principle ........................... 37,616(1) (34,977)(3) (63,032)(4) (13,470) (57,622)(5)
Earnings (loss) from continuing operations before
discontinued operations and cumulative effect of
change in accounting principle ............. 24,113 (28,838) (37,438) (7,071) (36,595)
Discontinued operations, net of tax ........... (1,077)(1) (1,591)(3) (3,601)(4) 4,333 1,088
Cumulative effect of change in accounting principle,
net of tax .......................... — — — 189 (2,021)
Net earnings (loss) ...................... 23,036 (30,429) (41,039) (2,549) (37,528)
BALANCE SHEET DATA
Working capital ........................ $ 205,525 $ 179,233 $ 195,343 $ 163,960 $ 247,526
Current ratio ......................... 1.40 to 1 1.33 to 1 1.35 to 1 1.27 to 1 1.43 to 1
Merchandise inventories .................. $ 559,118 $ 564,931 $ 561,152 $ 607,042 $ 616,292
Property and equipment-net ................ $ 706,450 $ 740,331 $ 780,779 $ 906,247 $ 947,389
Total assets .......................... $1,499,086 $ 1,552,389 $ 1,583,920 $ 1,767,199 $ 1,821,753
Long-term debt, excluding current maturities ..... $ 306,201 $ 352,382 $ 400,016 $ 535,031 $ 586,239
Total stockholders’ equity ................. $ 443,295 $ 423,156 $ 470,712 $ 567,755 $ 594,565
DATA PER COMMON SHARE
Basic earnings (loss) from continuing operations
before discontinued operations and cumulative
effect of change in accounting principle ....... $ 0.46 $ (0.55) $ (0.72) $ (0.13) $ (0.67)
Basic earnings (loss) net .................. 0.44 (0.58) (0.79) (0.05) (0.69)
Diluted earnings (loss) from continuing operations
before discontinued operations and cumulative
effect of change in accounting principal ....... 0.46 (0.55) (0.72) (0.13) (0.67)
Diluted earnings (loss) net ................. 0.44 (0.58) (0.79) (0.05) (0.69)
Cash dividends declared .................. 0.12 0.27 0.27 0.27 0.27
Book value per share .................... 8.46 8.10 9.10 10.53 10.97
Common share price range:
High ............................. 10.83 12.56 22.49 16.55 18.80
Low ............................. 2.76 2.62 8.25 9.33 11.75
OTHER STATISTICS
Return on average stockholders’ equity(8) ....... 5.3% (6.8)% (7.9)% (0.4)% (6.0)%
Common shares issued and outstanding ........ 52,392,967 52,237,750 51,752,677 53,934,084 54,208,803
Capital expenditures ..................... $ 43,214 $ 151,883(9) $ 43,116 $ 53,903 $ 92,083
Number of stores ....................... 587 562 562 593 593
Number of service bays ................... 6,027 5,845 5,845 6,162 6,162
(1) Includes an aggregate pretax charge of $3,110 for asset impairment, of which $2,211 was charged to merchandise cost of
sales, $673 was charged to service cost of sales and $226 (pretax) was charged to discontinued operations.
(2) Fiscal 2009 includes gain from debt retirement of $6,248. Fiscal 2008 includes a gain from debt retirement of $3,460,
partially offset by a $1,172 charge for deferred financing costs.
19