Pep Boys 2009 Annual Report Download - page 30
Download and view the complete annual report
Please find page 30 of the 2009 Pep Boys annual report below. You can navigate through the pages in the report by either clicking on the pages listed below, or by using the keyword search tool below to find specific information within the annual report.-
 1
1 -
2
-
3
-
4
-
5
-
6
-
7
-
8
-
9
-
10
-
11
-
12
-
13
-
14
-
15
-
16
-
17
-
18
-
19
-
 20
20 -
 21
21 -
 22
22 -
 23
23 -
 24
24 -
 25
25 -
 26
26 -
 27
27 -
 28
28 -
 29
29 -
 30
30 -
 31
31 -
 32
32 -
 33
33 -
 34
34 -
 35
35 -
 36
36 -
 37
37 -
 38
38 -
 39
39 -
 40
40 -
41
-
42
-
43
-
44
-
45
-
46
-
47
-
48
-
49
-
50
-
51
-
52
-
53
-
54
-
55
-
56
-
57
-
58
-
59
-
60
-
61
-
62
-
63
-
64
-
65
-
66
-
67
-
68
-
69
-
70
-
71
-
72
-
73
-
74
-
75
-
76
-
77
-
78
-
79
-
80
-
81
-
82
-
83
-
84
-
85
-
86
-
87
-
88
-
89
-
90
-
91
-
92
-
93
-
94
-
95
-
96
-
97
-
98
-
99
-
100
-
101
-
102
-
103
-
104
-
105
-
106
-
107
-
108
-
109
-
110
-
111
-
112
-
113
-
114
-
115
-
116
-
117
-
118
-
119
-
120
-
121
-
122
-
123
-
124
-
125
-
126
-
127
-
128
-
129
-
130
-
131
-
132
-
133
-
134
-
135
-
136
-
137
-
138
-
139
-
140
-
141
-
142
-
143
-
144
-
145
-
146
-
147
-
148
-
149
-
150
-
151
-
152
-
153
-
154
-
155
-
156
-
157
-
158
-
159
-
160
-
161
-
162
-
163
-
164
 |
 |

24
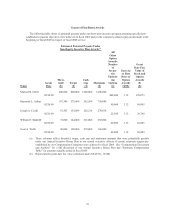
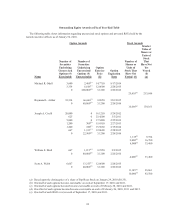
Outstanding Equity Awards at Fiscal Year-End Table
The following table shows information regarding unexercised stock options and unvested RSUs held by the
named executive officers as of January 30, 2010.
Option Awards Stock Awards
Name
Number of
Securities
Underlying
Unexercised
Options (#)
Exercisable
Number of
Securities
Underlying
Unexercised
Options (#)
Unexercisable
Option
Exercise
Price
($)
Option
Expiration
Date
Number of
Shares or
Units of
Stock That
Have Not
Vested (#)
Market
Value of
Shares or
Units of
Stock
That
Have Not
Yet
Vested
($)
(a)
Michael R. Odell 3,600 2,400(b) 14.7750 9/17/2014
3,334 6,666(c) 12.0600 2/28/2015
0 400,000(d) 3.1200 2/26/2016
25,610(e) 213,844
Raymond L. Arthur 33,334 66,666(f) 9.0950 5/01/2015
0 40,000(d) 3.1200 2/26/2016
16,666(g) 139,161
Joseph A. Cirelli 20,000 0 16.1250 5/29/2012
625 0 23.4200 3/3/2011
5,000 0 17.5400 2/25/2012
1,200 300(h) 15.8550 2/27/2013
1,200 800(i) 15.9650 2/15/2014
667 1,333(c) 12.0600 2/28/2015
0 22,500(d) 3.1200 2/26/2016
1,125(j) 9,394
2,000(k) 16,700
4,000(l) 33,400
William E. Shull 667 1,333(m) 9.2550 9/2/2015
0 40,000(d) 3.1200 2/26/2016
4,000(n) 33,400
Scott A. Webb 6,667 13,333(c) 12.0600 2/28/2015
0 40,000(d) 3.1200 2/26/2016
11,145(o) 93,061
10,000(l) 83,500
(a) Based upon the closing price of a share of Pep Boys Stock on January 29, 2010 ($8.35).
(b) One-half of such options become exercisable on each of September 17, 2010 and 2011.
(c) One-half of such options became/become exercisable on each of February 28, 2010 and 2011.
(d) One-third of such options became/become exercisable on each of February 26, 2010, 2011 and 2012.
(e) One-half of such RSUs vest on each of September 17, 2010 and 2011.