Pep Boys 2009 Annual Report Download - page 122
Download and view the complete annual report
Please find page 122 of the 2009 Pep Boys annual report below. You can navigate through the pages in the report by either clicking on the pages listed below, or by using the keyword search tool below to find specific information within the annual report.-
 1
1 -
2
-
3
-
4
-
5
-
6
-
7
-
8
-
9
-
10
-
11
-
12
-
13
-
14
-
15
-
16
-
17
-
18
-
19
-
20
-
21
-
22
-
23
-
24
-
25
-
26
-
27
-
28
-
29
-
30
-
31
-
32
-
33
-
34
-
35
-
36
-
37
-
38
-
39
-
40
-
41
-
42
-
43
-
44
-
45
-
46
-
47
-
48
-
49
-
50
-
51
-
52
-
53
-
54
-
55
-
56
-
57
-
58
-
59
-
60
-
61
-
62
-
63
-
64
-
65
-
66
-
67
-
68
-
69
-
70
-
71
-
72
-
73
-
74
-
75
-
76
-
77
-
78
-
79
-
80
-
81
-
82
-
83
-
84
-
85
-
86
-
87
-
88
-
89
-
90
-
91
-
92
-
93
-
94
-
95
-
96
-
97
-
98
-
99
-
100
-
101
-
102
-
103
-
104
-
105
-
106
-
107
-
108
-
109
-
110
-
111
-
 112
112 -
 113
113 -
 114
114 -
 115
115 -
 116
116 -
 117
117 -
 118
118 -
 119
119 -
 120
120 -
 121
121 -
 122
122 -
 123
123 -
 124
124 -
 125
125 -
 126
126 -
 127
127 -
 128
128 -
 129
129 -
 130
130 -
 131
131 -
 132
132 -
133
-
134
-
135
-
136
-
137
-
138
-
139
-
140
-
141
-
142
-
143
-
144
-
145
-
146
-
147
-
148
-
149
-
150
-
151
-
152
-
153
-
154
-
155
-
156
-
157
-
158
-
159
-
160
-
161
-
162
-
163
-
164
 |
 |

THE PEP BOYS—MANNY, MOE & JACK AND SUBSIDIARIES
NOTES TO CONSOLIDATED FINANCIAL STATEMENTS (Continued)
Years ended January 30, 2010, January 31, 2009 and February 2, 2008
(dollar amounts in thousands, except share and per share data)
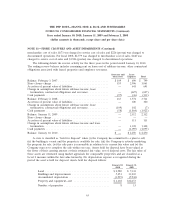
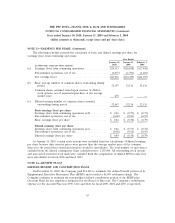
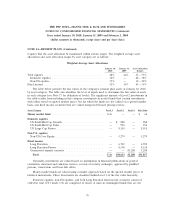
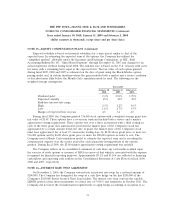
NOTE 11—STORE CLOSURES AND ASSET IMPAIRMENTS (Continued)
During fiscal 2009, the Company sold four stores for $3,602 and recorded a net gain of $155 of
which $109 is reported in discontinued operations. The company also decided to reopen one store and
moved the asset value of $1,658 to property and equipment. In response to a continuing weak real
estate market, the Company reduced its prices for certain properties and recorded a $3,110 impairment
charge. The Company classifies properties as held for disposal as it continues to actively market these
properties at prices the Company believes reasonable given current market conditions and expects to
sell these properties within the next twelve months.
During fiscal 2008, the Company sold six properties for $6,694 and recorded a net gain of $428 of
which $52 is reported in discontinued operations. On August 2, 2008, the Company purchased 29
master lease properties of which four were classified as ‘‘held for disposal.’’ In response to a weak real
estate market, the Company reduced its prices and recorded a $3,075 impairment charge during fiscal
2008.
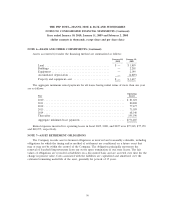
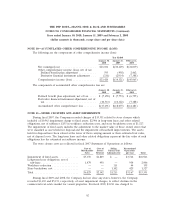
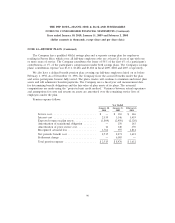
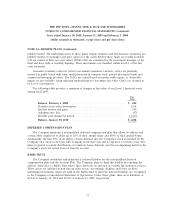
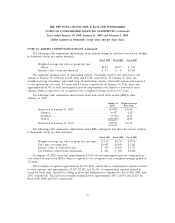
NOTE 12—DISCONTINUED OPERATIONS
The Company’s discontinued operations reflect the operating results for closed stores where the
customer base was lost. Below is a summary of the results of discontinued operations:
January 30, January 31, February 2,
Year ended 2010 2009 2008
Merchandise sales ....................... $ — $ — $21,422
Service revenue ......................... — — 3,988
Total revenues .......................... $ — $ — $25,410
Loss from discontinued operations (pretax) ..... $(1,657) $(2,448) $(6,064)
Loss from discontinued operations relates to expenses for previously closed stores and principally
includes costs for rent, taxes, payroll, repairs and maintenance, asset impairments, and gains or losses
on disposal.
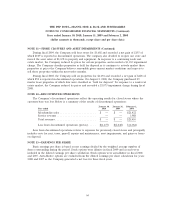
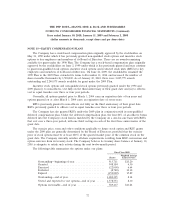
NOTE 13—EARNINGS PER SHARE
Basic earnings per share is based on net earnings divided by the weighted average number of
shares outstanding during the period. Stock options were dilutive in fiscal 2009 and as such were
included in the diluted earnings per share calculation. Stock options were anti-dilutive in fiscal 2008
and 2007. Anti-dilutive options are excluded from the diluted earnings per share calculation for years
2008 and 2007 as the Company generated a net loss for these fiscal years.
64