OfficeMax 2008 Annual Report Download - page 94
Download and view the complete annual report
Please find page 94 of the 2008 OfficeMax annual report below. You can navigate through the pages in the report by either clicking on the pages listed below, or by using the keyword search tool below to find specific information within the annual report.-
 1
1 -
2
-
3
-
4
-
5
-
6
-
7
-
8
-
9
-
10
-
11
-
12
-
13
-
14
-
15
-
16
-
17
-
18
-
19
-
20
-
21
-
22
-
23
-
24
-
25
-
26
-
27
-
28
-
29
-
30
-
31
-
32
-
33
-
34
-
35
-
36
-
37
-
38
-
39
-
40
-
41
-
42
-
43
-
44
-
45
-
46
-
47
-
48
-
49
-
50
-
51
-
52
-
53
-
54
-
55
-
56
-
57
-
58
-
59
-
60
-
61
-
62
-
63
-
64
-
65
-
66
-
67
-
68
-
69
-
70
-
71
-
72
-
73
-
74
-
75
-
76
-
77
-
78
-
79
-
80
-
81
-
82
-
83
-
 84
84 -
 85
85 -
 86
86 -
 87
87 -
 88
88 -
 89
89 -
 90
90 -
 91
91 -
 92
92 -
 93
93 -
 94
94 -
 95
95 -
 96
96 -
 97
97 -
 98
98 -
 99
99 -
 100
100 -
 101
101 -
 102
102 -
 103
103 -
 104
104 -
105
-
106
-
107
-
108
-
109
-
110
-
111
-
112
-
113
-
114
-
115
-
116
-
117
-
118
-
119
-
120
 |
 |

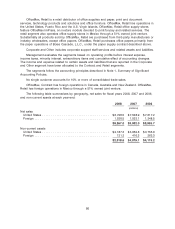
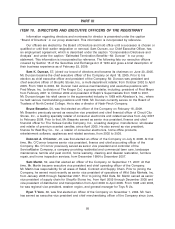
We have been notified that we are a ‘‘potentially responsible party’’ under the Comprehensive
Environmental Response Compensation and Liability Act (‘‘CERCLA’’) or similar federal and state
laws, or have received a claim from a private party, with respect to certain sites where hazardous
substances or other contaminants are or may be located. These sites relate to operations either no
longer owned by the Company or unrelated to its ongoing operations. For sites where a range of
potential liability can be determined, we have established appropriate reserves. We cannot predict
with certainty the total response and remedial costs, our share of the total costs, the extent to
which contributions will be available from other parties or the amount of time necessary to complete
the cleanups. Based on our investigations; our experience with respect to cleanup of hazardous
substances; the fact that expenditures will, in many cases, be incurred over extended periods of
time; and in some cases, the number of solvent potentially responsible parties, we do not believe
that the known actual and potential response costs will, in the aggregate, materially affect our
financial position, results of operations or cash flows.
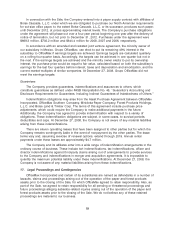
Over the past several years and continuing in 2009, we have been named a defendant in a
number of cases where the plaintiffs allege asbestos-related injuries from exposure to asbestos
products or exposure to asbestos while working at job sites. The claims vary widely and often are
not specific about the plaintiffs’ contacts with the Company. None of the claimants seeks damages
from us individually, and we are generally one of numerous defendants. Many of the cases filed
against us have been voluntarily dismissed, although we have settled some cases. The settlements
we have paid have been covered mostly by insurance, and we believe any future settlements or
judgments in these cases would be similarly covered. To date, no asbestos case against us has
gone to trial, and the nature of these cases makes any prediction as to the outcome of pending
litigation inherently subjective. At this time, however, we believe our involvement in asbestos
litigation is not material to either our financial position or our results of operations.
18. Quarterly Results of Operations (unaudited)
Summarized quarterly financial data is as follows:
2008 2007
First(a) Second(b) Third(c) Fourth(d) First(e) Second Third Fourth(f)
(millions, except per-share and stock price information)
Sales ......................... $2,303 $ 1,985 $2,096 $1,883 $2,436 $2,132 $2,315 $2,199
Income (loss) from continuing operations . . 63 (894) (432) (395) 59 27 50 71
Net income (loss) ................. 63 (894) (432) (395) 59 27 50 71
Net income (loss) per common share from
continuing operations(g)
Basic ....................... .82 (11.79) (5.70) (5.21) .77 .35 .65 .93
Diluted ...................... .81 (11.79) (5.70) (5.21) .76 .35 .64 .92
Net income (loss) per common share(g)
Basic ....................... .82 (11.79) (5.70) (5.21) .77 .35 .65 .93
Diluted ...................... .81 (11.79) (5.70) (5.21) .76 .35 .64 .92
Common stock dividends paid per share . . .15 .15 .15 .15 .15 .15 .15 .15
Common stock prices(h)
High ........................ 25.64 22.22 16.23 10.96 55.40 54.38 40.16 34.89
Low ........................ 17.12 13.41 9.14 2.84 47.87 38.64 30.96 20.38
(a) Includes a $2.4 million charge related to the consolidation of the Contract segment’s manufacturing facilities in New
Zealand, a $1.8 million charge related to restructuring the Retail field and ImPress print and document services
management organization and a gain of $20.5 million related to a tax distribution from Boise Cascade, L.L.C.
(b) Includes a $935.3 million non-cash charge related to impairment of goodwill, trade names and fixed assets. (Contract
$464.0 million and Retail $471.3 million), a $10.2 million charge related to employee severance from the reorganization
of Retail store management, and a gain of 3.1 million related to the legacy Voyageur Panel business sold in 2004.
90