OfficeMax 2008 Annual Report Download - page 50
Download and view the complete annual report
Please find page 50 of the 2008 OfficeMax annual report below. You can navigate through the pages in the report by either clicking on the pages listed below, or by using the keyword search tool below to find specific information within the annual report.-
 1
1 -
2
-
3
-
4
-
5
-
6
-
7
-
8
-
9
-
10
-
11
-
12
-
13
-
14
-
15
-
16
-
17
-
18
-
19
-
20
-
21
-
22
-
23
-
24
-
25
-
26
-
27
-
28
-
29
-
30
-
31
-
32
-
33
-
34
-
35
-
36
-
37
-
38
-
39
-
 40
40 -
 41
41 -
 42
42 -
 43
43 -
 44
44 -
 45
45 -
 46
46 -
 47
47 -
 48
48 -
 49
49 -
 50
50 -
 51
51 -
 52
52 -
 53
53 -
 54
54 -
 55
55 -
 56
56 -
 57
57 -
 58
58 -
 59
59 -
 60
60 -
61
-
62
-
63
-
64
-
65
-
66
-
67
-
68
-
69
-
70
-
71
-
72
-
73
-
74
-
75
-
76
-
77
-
78
-
79
-
80
-
81
-
82
-
83
-
84
-
85
-
86
-
87
-
88
-
89
-
90
-
91
-
92
-
93
-
94
-
95
-
96
-
97
-
98
-
99
-
100
-
101
-
102
-
103
-
104
-
105
-
106
-
107
-
108
-
109
-
110
-
111
-
112
-
113
-
114
-
115
-
116
-
117
-
118
-
119
-
120
 |
 |

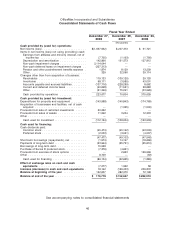
OfficeMax Incorporated and Subsidiaries
Consolidated Statements of Cash Flows
Fiscal Year Ended
December 27, December 29, December 30,
2008 2007 2006
(thousands)
Cash provided by (used for) operations:
Net income (loss) ......................... $(1,657,932) $ 207,373 $ 91,721
Items in net income (loss) not using (providing) cash:
Earnings from affiliates and minority interest, net of
income tax .......................... (7,705) (1,193) (1,790)
Depreciation and amortization ............... 142,896 131,573 127,812
Non-cash impairment charges ............... 2,114,044 — —
Non-cash deferred taxes on impairment charges . . (357,313) — —
Pension and other postretirement benefits expense . 1,874 8,159 13,239
Other ................................ 329 32,096 39,114
Changes other than from acquisition of business:
Receivables ........................... 119,133 (139,120) 29,126
Inventories ............................ 98,111 (3,585) 43,001
Accounts payable and accrued liabilities ........ (137,716) (228,269) 8,662
Current and deferred income taxes ........... (40,698) (11,521) 58,683
Other ................................ (51,346) 75,091 (33,929)
Cash provided by operations ............... 223,677 70,604 375,639
Cash provided by (used for) investment:
Expenditures for property and equipment ......... (143,968) (140,843) (174,769)
Acquisition of businesses and facilities, net of cash
acquired ............................. — (1,325) (1,500)
Proceeds from sale of restricted investments ...... 20,252 — —
Proceeds from sales of assets ................ 11,592 3,234 12,333
Other ................................. — — —
Cash used for investment .................. (112,124) (138,934) (163,936)
Cash used for financing:
Cash dividends paid:
Common stock ......................... (45,474) (45,142) (43,509)
Preferred stock ......................... (2,003) (3,961) (4,037)
(47,477) (49,103) (47,546)
Short-term borrowings (repayments), net ......... (1,974) 14,197 (18,666)
Payments of long-term debt .................. (53,944) (25,751) (65,610)
Borrowings of long-term debt ................. 15,928 — —
Purchase of Series D preferred stock ............ (7,376) (4,621) —
Proceeds from exercise of stock options ......... — 2,653 129,966
Other ................................. 8,709 — (33)
Cash used for financing ................... (86,134) (62,625) (1,889)
Effect of exchange rates on cash and cash
equivalents ........................... (7,277) 1,522 58
Increase (decrease) in cash and cash equivalents . 18,142 (129,433) 209,872
Balance at beginning of the year ............. 152,637 282,070 72,198
Balance at end of the year .................. $ 170,779 $ 152,637 $ 282,070
See accompanying notes to consolidated financial statements
46