OfficeMax 2008 Annual Report Download - page 51
Download and view the complete annual report
Please find page 51 of the 2008 OfficeMax annual report below. You can navigate through the pages in the report by either clicking on the pages listed below, or by using the keyword search tool below to find specific information within the annual report.-
 1
1 -
2
-
3
-
4
-
5
-
6
-
7
-
8
-
9
-
10
-
11
-
12
-
13
-
14
-
15
-
16
-
17
-
18
-
19
-
20
-
21
-
22
-
23
-
24
-
25
-
26
-
27
-
28
-
29
-
30
-
31
-
32
-
33
-
34
-
35
-
36
-
37
-
38
-
39
-
40
-
 41
41 -
 42
42 -
 43
43 -
 44
44 -
 45
45 -
 46
46 -
 47
47 -
 48
48 -
 49
49 -
 50
50 -
 51
51 -
 52
52 -
 53
53 -
 54
54 -
 55
55 -
 56
56 -
 57
57 -
 58
58 -
 59
59 -
 60
60 -
 61
61 -
62
-
63
-
64
-
65
-
66
-
67
-
68
-
69
-
70
-
71
-
72
-
73
-
74
-
75
-
76
-
77
-
78
-
79
-
80
-
81
-
82
-
83
-
84
-
85
-
86
-
87
-
88
-
89
-
90
-
91
-
92
-
93
-
94
-
95
-
96
-
97
-
98
-
99
-
100
-
101
-
102
-
103
-
104
-
105
-
106
-
107
-
108
-
109
-
110
-
111
-
112
-
113
-
114
-
115
-
116
-
117
-
118
-
119
-
120
 |
 |

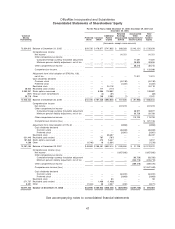
OfficeMax Incorporated and Subsidiaries
Consolidated Statements of Shareholders’ Equity
For the Fiscal Years ended December 27, 2008, December 29, 2007 and
December 30, 2006
Retained Accumulated Total
Common Additional Earnings Other Share-
Shares Preferred Common Paid-In (Accumulated Comprehensive holders’
Outstanding Stock Stock Capital Deficit) Income (Loss) Equity
(thousands, except share amounts)
70,804,612 Balance at December 31, 2005 ............. $54,735 $ 176,977 $ 747,805 $ 898,283 $ (142,121) $ 1,735,679
Comprehensive income
Net income ........................ — — — 91,721 — 91,721
Other comprehensive income
Cumulative foreign currency translation adjustment — — — — 11,581 11,581
Minimum pension liability adjustment, net of tax . — — — — 26,634 26,634
Other comprehensive income ............. — — — — 38,215 38,215
Comprehensive income ................. $ 129,936
Adjustment from initial adoption of SFAS No. 158,
net of tax ......................... — — — — 11,911 11,911
Cash dividends declared
Common stock ..................... — — — (44,136) — (44,136)
Preferred stock ..................... — — — (4,037) — (4,037)
Restricted stock ...................... — — 24,116 — — 24,116
46,940 Restricted stock vested .................. — 117 (117) — — —
3,993,857 Stock options exercised .................. — 9,985 119,982 — — 129,967
(907) Treasury stock cancellations ............... — (2) (31) — — (33)
58,718 Other ............................ — 149 2,093 (1) — 2,241
74,903,220 Balance at December 30, 2006 ............. $54,735 $ 187,226 $ 893,848 $ 941,830 $ (91,995) $ 1,985,644
Comprehensive income
Net income ........................ — — — 207,373 — 207,373
Other comprehensive income .............
Cumulative foreign currency translation adjustment — — — — 59,977 59,977
Minimum pension liability adjustment, net of tax . — — — — 53,756 53,756
Other comprehensive income ............. — — — — 113,733 113,733
Comprehensive income (loss) ............. $ 321,106
Adjustment from initial adoption of FIN 48 ....... — — — (3,959) — (3,959)
Cash dividends declared
Common stock .................... — — — (45,333) — (45,333)
Preferred stock .................... — — — (3,961) — (3,961)
Restricted stock ...................... — — 26,437 — — 26,437
301,443 Restricted stock vested .................. — 767 (767) — — —
187,843 Stock options exercised .................. — 470 5,447 — — 5,917
4,588 Other ............................ (4,746) 18 (2,551) — — (7,279)
75,397,094 Balance at December 29, 2007 ............. $49,989 $ 188,481 $ 922,414 $ 1,095,950 $ 21,738 $ 2,278,572
Comprehensive income (loss)
Net income ........................ — — — (1,657,932) — (1,657,932)
Other comprehensive income .............
Cumulative foreign currency translation adjustment — — — — (83,758) (83,758)
Minimum pension liability adjustment, net of tax . — — — — (205,718) (205,718)
Other comprehensive income ............. — — — — (289,476) (289,476)
Comprehensive income (loss) ............. $(1,947,408)
Cash dividends declared
Common stock .................... — — — (34,220) — (34,220)
Preferred stock .................... — — — (3,663) — (3,663)
Restricted stock ...................... — — 93 — — 93
571,727 Restricted stock vested .................. — 1,436 (1,436) — — —
8,331 Other ............................ (7,424) 26 4,257 (230) (3,371)
75,977,152 Balance at December 27, 2008 ............. $42,565 $189,943 $925,328 $ (600,095) $(267,738) $ 290,003
See accompanying notes to consolidated financial statements
47