OfficeMax 2008 Annual Report Download - page 84
Download and view the complete annual report
Please find page 84 of the 2008 OfficeMax annual report below. You can navigate through the pages in the report by either clicking on the pages listed below, or by using the keyword search tool below to find specific information within the annual report.-
 1
1 -
2
-
3
-
4
-
5
-
6
-
7
-
8
-
9
-
10
-
11
-
12
-
13
-
14
-
15
-
16
-
17
-
18
-
19
-
20
-
21
-
22
-
23
-
24
-
25
-
26
-
27
-
28
-
29
-
30
-
31
-
32
-
33
-
34
-
35
-
36
-
37
-
38
-
39
-
40
-
41
-
42
-
43
-
44
-
45
-
46
-
47
-
48
-
49
-
50
-
51
-
52
-
53
-
54
-
55
-
56
-
57
-
58
-
59
-
60
-
61
-
62
-
63
-
64
-
65
-
66
-
67
-
68
-
69
-
70
-
71
-
72
-
73
-
 74
74 -
 75
75 -
 76
76 -
 77
77 -
 78
78 -
 79
79 -
 80
80 -
 81
81 -
 82
82 -
 83
83 -
 84
84 -
 85
85 -
 86
86 -
 87
87 -
 88
88 -
 89
89 -
 90
90 -
 91
91 -
 92
92 -
 93
93 -
 94
94 -
95
-
96
-
97
-
98
-
99
-
100
-
101
-
102
-
103
-
104
-
105
-
106
-
107
-
108
-
109
-
110
-
111
-
112
-
113
-
114
-
115
-
116
-
117
-
118
-
119
-
120
 |
 |

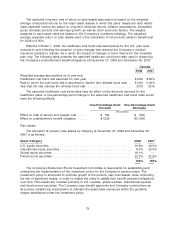
The current asset allocation guidelines set forth a U.S. equity range of 15% to 25%, an
international equity range of 5% to 15%, a global equity range of 15% to 25% and a fixed-income
range of 45% to 55%. Asset-class positions within the ranges are continually evaluated and
adjusted based on expectations for future returns, the funded position of the plans and market
risks. Occasionally, the Company may utilize futures or other financial instruments to alter the
pension trust’s exposure to various asset classes in a lower-cost manner than trading securities in
the underlying portfolios. At December 27, 2008 and December 29, 2007, the pension trust did not
have any equity investments in the Company’s common stock.
Cash Flows
Pension plan contributions include required statutory minimums and, in some years, additional
discretionary amounts. During 2008, 2007 and 2006, the Company made cash contributions to its
pension plans totaling $13.1 million, $19.1 million and $9.6 million, respectively. Minimum
contribution requirements for 2009 are approximately $6.7 million. However, the Company may elect
to make additional voluntary contributions. For further information related to pension plans, see
Contractural Obligations and Disclosures of Financial Market Risks in ‘‘Item 7. Managements’
Discussion and Analysis of Financial Condition and Results of Operations’’ of this Form 10K.
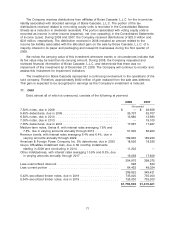
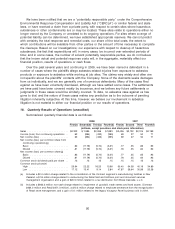
Qualified pension benefit payments are paid from the assets held in the plan trust, while
nonqualified pension and other benefit payments are paid by the Company. Future benefit
payments by year are estimated to be as follows:
Pension Other
Benefits Benefits
(thousands)
2009 ..................................................... $102,253 $1,746
2010 ..................................................... 100,908 1,651
2011 ..................................................... 99,785 1,557
2012 ..................................................... 99,100 1,473
2013 ..................................................... 97,892 1,415
Years 2014-2018 ............................................ 473,387 6,569
Defined Contribution Plans
The Company also sponsors defined contribution plans for most of its employees. Through
2004, the Company sponsored four contributory defined contribution savings plans for most of its
salaried and hourly employees: a plan for OfficeMax, Retail employees, a plan for non-Retail
salaried employees, a plan for union hourly employees, and a plan for non-Retail, nonunion hourly
employees. The plan for non-Retail salaried employees included an employee stock ownership plan
(‘‘ESOP’’) component through which the Company matches contributions of eligible employees.
Under that plan, the Company’s Series D ESOP convertible preferred stock was allocated to eligible
participants, as principal and interest payments are made on the ESOP debt by the plan. The
ESOP debt was guaranteed by the Company. (See Note 14, Shareholders’ Equity for additional
information related to the ESOP.) The final principal and interest payments on the ESOP debt were
made on June 30, 2004. All remaining shares were allocated to the ESOP participants as matching
contributions in 2005. As a result, Company matching contributions for ESOP participants are now
made in cash. In January 2005, all of the remaining savings plans were merged into a single plan.
Total Company contributions to the defined contribution savings plans were $8.0 million in 2008,
$8.1 million in 2007 and $7.8 million in 2006.
80