OfficeMax 2008 Annual Report Download - page 69
Download and view the complete annual report
Please find page 69 of the 2008 OfficeMax annual report below. You can navigate through the pages in the report by either clicking on the pages listed below, or by using the keyword search tool below to find specific information within the annual report.-
 1
1 -
2
-
3
-
4
-
5
-
6
-
7
-
8
-
9
-
10
-
11
-
12
-
13
-
14
-
15
-
16
-
17
-
18
-
19
-
20
-
21
-
22
-
23
-
24
-
25
-
26
-
27
-
28
-
29
-
30
-
31
-
32
-
33
-
34
-
35
-
36
-
37
-
38
-
39
-
40
-
41
-
42
-
43
-
44
-
45
-
46
-
47
-
48
-
49
-
50
-
51
-
52
-
53
-
54
-
55
-
56
-
57
-
58
-
 59
59 -
 60
60 -
 61
61 -
 62
62 -
 63
63 -
 64
64 -
 65
65 -
 66
66 -
 67
67 -
 68
68 -
 69
69 -
 70
70 -
 71
71 -
 72
72 -
 73
73 -
 74
74 -
 75
75 -
 76
76 -
 77
77 -
 78
78 -
 79
79 -
80
-
81
-
82
-
83
-
84
-
85
-
86
-
87
-
88
-
89
-
90
-
91
-
92
-
93
-
94
-
95
-
96
-
97
-
98
-
99
-
100
-
101
-
102
-
103
-
104
-
105
-
106
-
107
-
108
-
109
-
110
-
111
-
112
-
113
-
114
-
115
-
116
-
117
-
118
-
119
-
120
 |
 |

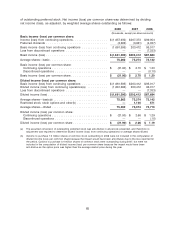
of outstanding preferred stock. Net income (loss) per common share was determined by dividing
net income (loss), as adjusted, by weighted average shares outstanding as follows:
2008 2007 2006
(thousands, except per-share amounts)
Basic income (loss) per common share:
Income (loss) from continuing operations ................... $(1,657,932) $ 207,373 $ 99,054
Preferred dividends .................................. (3,663) (3,961) (4,037)
Basic income (loss) from continuing operations .............. (1,661,595) 203,412 95,017
Loss from discontinued operations ....................... — — (7,333)
Basic income (loss) .................................. $(1,661,595) $203,412 $87,684
Average shares—basic ................................ 75,862 75,274 73,142
Basic income (loss) per common share:
Continuing operations ............................... $ (21.90) $ 2.70 $ 1.30
Discontinued operations ............................. — — (0.10)
Basic income (loss) per common share .................... $ (21.90) $ 2.70 $ 1.20
Diluted income (loss) per common share:
Basic income (loss) from continuing operations .............. $(1,661,595) $ 203,412 $95,017
Diluted income (loss) from continuing operations(a) ........... (1,661,595) 203,412 95,017
Loss from discontinued operations ....................... — — (7,333)
Diluted income (loss) ................................. $(1,661,595) $203,412 $87,684
Average shares—basic(a) .............................. 75,862 75,274 73,142
Restricted stock, stock options and other(b) ................. — 1,100 571
Average shares—diluted ............................... 75,862 76,374 73,713
Diluted income (loss) per common share:
Continuing operations ............................... $ (21.90) $ 2.66 $ 1.29
Discontinued operations ............................. — — (.10)
Diluted income (loss) per common share ................... $ (21.90) $ 2.66 $ 1.19
(a) The assumed conversion of outstanding preferred stock was anti-dilutive in all periods presented, and therefore no
adjustment was required to determine diluted income (loss) from continuing operations or average shares-diluted.
(b) Options to purchase 1.5 million shares of common stock outstanding in 2008 were not included in the computation of
diluted income (loss) per common share because the impact would have been anti-dilutive due to the loss reported for
the period. Options to purchase 0.4 million shares of common stock were outstanding during 2007, but were not
included in the computation of diluted income (loss) per common share because the impact would have been
anti-dilutive as the option price was higher than the average market price during the year.
65