OfficeMax 2008 Annual Report Download - page 47
Download and view the complete annual report
Please find page 47 of the 2008 OfficeMax annual report below. You can navigate through the pages in the report by either clicking on the pages listed below, or by using the keyword search tool below to find specific information within the annual report.-
 1
1 -
2
-
3
-
4
-
5
-
6
-
7
-
8
-
9
-
10
-
11
-
12
-
13
-
14
-
15
-
16
-
17
-
18
-
19
-
20
-
21
-
22
-
23
-
24
-
25
-
26
-
27
-
28
-
29
-
30
-
31
-
32
-
33
-
34
-
35
-
36
-
 37
37 -
 38
38 -
 39
39 -
 40
40 -
 41
41 -
 42
42 -
 43
43 -
 44
44 -
 45
45 -
 46
46 -
 47
47 -
 48
48 -
 49
49 -
 50
50 -
 51
51 -
 52
52 -
 53
53 -
 54
54 -
 55
55 -
 56
56 -
 57
57 -
58
-
59
-
60
-
61
-
62
-
63
-
64
-
65
-
66
-
67
-
68
-
69
-
70
-
71
-
72
-
73
-
74
-
75
-
76
-
77
-
78
-
79
-
80
-
81
-
82
-
83
-
84
-
85
-
86
-
87
-
88
-
89
-
90
-
91
-
92
-
93
-
94
-
95
-
96
-
97
-
98
-
99
-
100
-
101
-
102
-
103
-
104
-
105
-
106
-
107
-
108
-
109
-
110
-
111
-
112
-
113
-
114
-
115
-
116
-
117
-
118
-
119
-
120
 |
 |

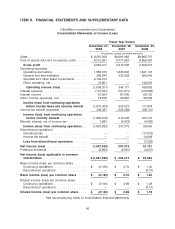
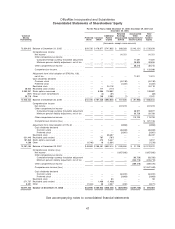
ITEM 8. FINANCIAL STATEMENTS AND SUPPLEMENTARY DATA
OfficeMax Incorporated and Subsidiaries
Consolidated Statements of Income (Loss)
Fiscal Year Ended
December 27, December 29, December 30,
2008 2007 2006
(thousands, except per-share amounts)
Sales ............................... $ 8,267,008 $9,081,962 $8,965,707
Cost of goods sold and occupancy costs ..... 6,212,591 6,771,657 6,656,497
Gross profit ........................ 2,054,417 2,310,305 2,309,210
Operating expenses
Operating and selling .................. 1,555,615 1,633,606 1,641,147
General and administrative .............. 306,940 332,528 355,945
Goodwill and other asset impairments ...... 2,100,212 — —
Other operating, net ................... 27,851 — 146,216
Operating income (loss) ............. (1,936,201) 344,171 165,902
Interest expense ....................... (113,641) (121,271) (123,082)
Interest income ........................ 57,564 87,940 89,723
Other income (expense), net .............. 19,878 26,687 39,335
Income (loss) from continuing operations
before income taxes and minority interest . (1,972,400) 337,527 171,878
Income tax benefit (expense) .............. 306,481 (125,282) (68,741)
Income (loss) from continuing operations
before minority interest .............. (1,665,919) 212,245 103,137
Minority interest, net of income tax .......... 7,987 (4,872) (4,083)
Income (loss) from continuing operations . . (1,657,932) 207,373 99,054
Discontinued operations
Operating loss ....................... — — (17,972)
Income tax benefit .................... — — 10,639
Loss from discontinued operations ....... — — (7,333)
Net income (loss) ...................... (1,657,932) 207,373 91,721
Preferred dividends ..................... (3,663) (3,961) (4,037)
Net income (loss) applicable to common
shareholders ........................ $(1,661,595) $ 203,412 $ 87,684
Basic income (loss) per common share
Continuing operations .................. $ (21.90) $ 2.70 $ 1.30
Discontinued operations ................ — — (0.10)
Basic income (loss) per common share ..... $ (21.90) $ 2.70 $ 1.20
Diluted income (loss) per common share
Continuing operations .................. $ (21.90) $ 2.66 $ 1.29
Discontinued operations ................ — — (0.10)
Diluted income (loss) per common share .... $ (21.90) $ 2.66 $ 1.19
See accompanying notes to consolidated financial statements
43