OfficeMax 2008 Annual Report Download - page 19
Download and view the complete annual report
Please find page 19 of the 2008 OfficeMax annual report below. You can navigate through the pages in the report by either clicking on the pages listed below, or by using the keyword search tool below to find specific information within the annual report.-
 1
1 -
2
-
3
-
4
-
5
-
6
-
7
-
8
-
 9
9 -
 10
10 -
 11
11 -
 12
12 -
 13
13 -
 14
14 -
 15
15 -
 16
16 -
 17
17 -
 18
18 -
 19
19 -
 20
20 -
 21
21 -
 22
22 -
 23
23 -
 24
24 -
 25
25 -
 26
26 -
 27
27 -
 28
28 -
 29
29 -
30
-
31
-
32
-
33
-
34
-
35
-
36
-
37
-
38
-
39
-
40
-
41
-
42
-
43
-
44
-
45
-
46
-
47
-
48
-
49
-
50
-
51
-
52
-
53
-
54
-
55
-
56
-
57
-
58
-
59
-
60
-
61
-
62
-
63
-
64
-
65
-
66
-
67
-
68
-
69
-
70
-
71
-
72
-
73
-
74
-
75
-
76
-
77
-
78
-
79
-
80
-
81
-
82
-
83
-
84
-
85
-
86
-
87
-
88
-
89
-
90
-
91
-
92
-
93
-
94
-
95
-
96
-
97
-
98
-
99
-
100
-
101
-
102
-
103
-
104
-
105
-
106
-
107
-
108
-
109
-
110
-
111
-
112
-
113
-
114
-
115
-
116
-
117
-
118
-
119
-
120
 |
 |

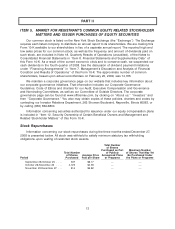
ITEM 6. SELECTED FINANCIAL DATA
The following table sets forth our selected financial data for the years indicated and should be
read in conjunction with the disclosures in ‘‘Item 7. Management’s Discussion and Analysis of
Financial Condition and Results of Operations’’ and ‘‘Item 8. Financial Statements and
Supplementary Data’’ of this Form 10-K.
2008(a) 2007(b) 2006(c) 2005(d) 2004(e)
(millions, except per-share amounts)
Assets
Current assets ............................. $ 1,855 $2,205 $2,097 $1,942 $ 3,241
Property and equipment, net .................. 491 581 580 535 541
Goodwill ................................. — 1,217 1,216 1,218 1,165
Timber notes receivable ...................... 899 1,635 1,635 1,635 1,635
Other ................................... 929 646 688 942 1,055
$ 4,174 $6,284 $6,216 $6,272 $ 7,637
Liabilities and shareholders’ equity
Current liabilities ........................... $1,197 $1,371 $1,529 $1,588 $ 1,857
Long-term debt, less current portion ............. 290 349 384 407 585
Timber notes securitized ..................... 1,470 1,470 1,470 1,470 1,470
Other ................................... 905 783 817 1,044 1,091
Minority interest ............................ 22 32 30 27 23
Shareholders’ equity ........................ 290 2,279 1,986 1,736 2,611
$ 4,174 $6,284 $6,216 $6,272 $ 7,637
Net sales ................................ $ 8,267 $9,082 $8,966 $9,158 $13,270
Income (loss) from:
Continuing operations ....................... $(1,658) $ 207 $ 99 $ (41) $ 234
Discontinued operations ...................... — — (7) (33) (61)
Net income (loss) .......................... $(1,658) $ 207 $ 92 $ (74) $ 173
Basic income (loss) per common share:
Continuing operations ....................... $(21.90) $ 2.70 $ 1.30 $ (0.58) $ 2.55
Discontinued operations ...................... — — (0.10) (0.41) (0.70)
Basic income (loss) per common share(f) ....... $(21.90) $ 2.70 $ 1.20 $ (0.99) $ 1.85
Diluted income (loss) per common share:
Continuing operations ....................... $(21.90) $ 2.66 $ 1.29 $ (0.58) $ 2.44
Discontinued operations ...................... — — (0.10) (0.41) (0.67)
Diluted income (loss) per common share(f) ...... $(21.90) $ 2.66 $ 1.19 $ (0.99) $ 1.77
Cash dividends declared per common share ....... $ 0.45 $ 0.60 $ 0.60 $ 0.60 $ 0.60
See notes on following page.
15