OfficeMax 2008 Annual Report Download - page 29
Download and view the complete annual report
Please find page 29 of the 2008 OfficeMax annual report below. You can navigate through the pages in the report by either clicking on the pages listed below, or by using the keyword search tool below to find specific information within the annual report.-
 1
1 -
2
-
3
-
4
-
5
-
6
-
7
-
8
-
9
-
10
-
11
-
12
-
13
-
14
-
15
-
16
-
17
-
18
-
 19
19 -
 20
20 -
 21
21 -
 22
22 -
 23
23 -
 24
24 -
 25
25 -
 26
26 -
 27
27 -
 28
28 -
 29
29 -
 30
30 -
 31
31 -
 32
32 -
 33
33 -
 34
34 -
 35
35 -
 36
36 -
 37
37 -
 38
38 -
 39
39 -
40
-
41
-
42
-
43
-
44
-
45
-
46
-
47
-
48
-
49
-
50
-
51
-
52
-
53
-
54
-
55
-
56
-
57
-
58
-
59
-
60
-
61
-
62
-
63
-
64
-
65
-
66
-
67
-
68
-
69
-
70
-
71
-
72
-
73
-
74
-
75
-
76
-
77
-
78
-
79
-
80
-
81
-
82
-
83
-
84
-
85
-
86
-
87
-
88
-
89
-
90
-
91
-
92
-
93
-
94
-
95
-
96
-
97
-
98
-
99
-
100
-
101
-
102
-
103
-
104
-
105
-
106
-
107
-
108
-
109
-
110
-
111
-
112
-
113
-
114
-
115
-
116
-
117
-
118
-
119
-
120
 |
 |

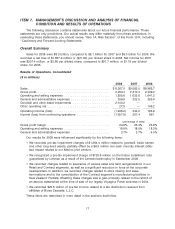
OfficeMax, Retail
($ in millions)
2008 2007 2006
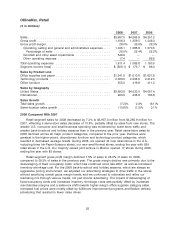
Sales ............................................. $3,957.0 $4,265.9 $4,251.2
Gross profit ........................................ 1,106.3 1,259.5 1,246.3
Gross profit margin ................................... 28.0% 29.5% 29.3%
Operating, selling and general and administrative expenses .... 1,045.1 1,085.8 1,070.5
Percentage of sales ............................... 26.5% 25.4% 25.2%
Goodwill and other asset impairments ................... 548.9 — —
Other operating expense ............................. 17.4 — 89.5
Total operating expenses .............................. 1,611.4 1,085.8 1,160.0
Segment income (loss) ................................ $ (505.1) $ 173.7 $ 86.3
Sales by Product Line
Office supplies and paper .............................. $1,541.5 $1,610.6 $1,627.5
Technology products ................................. 2,060.5 2,235.5 2,212.5
Office furniture ...................................... 355.0 419.8 411.2
Sales by Geography
United States ....................................... $3,693.5 $4,030.0 $4,057.4
International ........................................ 263.5 235.9 193.8
Sales Growth
Total sales growth .................................... (7.2)% 0.3% (6.1)%
Same-location sales growth ............................. (10.8)% (1.2)% 0.1%
2008 Compared With 2007
Retail segment sales for 2008 decreased by 7.2% to $3,957.0 million from $4,265.9 million for
2007, reflecting a same-store sales decrease of 10.8%, partially offset by sales from new stores. The
weaker U.S. consumer and small business spending was evidenced by lower store traffic and
weaker back-to-school and holiday seasons than in the previous year. Retail same-store sales for
2008 declined across all major product categories, compared to the prior year. Declines were
greatest in the higher-priced, discretionary furniture and technology product categories, which
resulted in decreased average tickets. During 2008, we opened 43 new retail stores in the U.S.,
including three Ink-Paper-Scissors stores, our new small-format stores, ending the year with 939
retail stores in the U.S. Our majority owned joint-venture in Mexico opened 17 stores during 2008,
ending the year with 83 stores.
Retail segment gross profit margin declined 1.5% of sales to 28.0% of sales for 2008,
compared to 29.5% of sales in the previous year. The gross margin decline was primarily due to the
deleveraging of fixed occupancy costs, which has continued since late-2007, as well as increased
inventory shrinkage cost. For the 2008 back-to-school and holiday seasons, which are always an
aggressive pricing environment, we adjusted our advertising strategies to drive traffic in the stores
without sacrificing overall gross margin levels, and we continued to rationalize and refine our
marketing mix through various media, not just circular advertising. The impact of deleveraging of
fixed-occupancy costs and increased inventory shrinkage costs was partially offset by increased
merchandise margins and a sales-mix shift towards higher-margin office supplies category sales.
Increased fuel prices were mostly offset by fulfillment improvement programs and flexible delivery
scheduling that resulted in fewer miles driven.
25