OfficeMax 2008 Annual Report Download - page 27
Download and view the complete annual report
Please find page 27 of the 2008 OfficeMax annual report below. You can navigate through the pages in the report by either clicking on the pages listed below, or by using the keyword search tool below to find specific information within the annual report.-
 1
1 -
2
-
3
-
4
-
5
-
6
-
7
-
8
-
9
-
10
-
11
-
12
-
13
-
14
-
15
-
16
-
 17
17 -
 18
18 -
 19
19 -
 20
20 -
 21
21 -
 22
22 -
 23
23 -
 24
24 -
 25
25 -
 26
26 -
 27
27 -
 28
28 -
 29
29 -
 30
30 -
 31
31 -
 32
32 -
 33
33 -
 34
34 -
 35
35 -
 36
36 -
 37
37 -
38
-
39
-
40
-
41
-
42
-
43
-
44
-
45
-
46
-
47
-
48
-
49
-
50
-
51
-
52
-
53
-
54
-
55
-
56
-
57
-
58
-
59
-
60
-
61
-
62
-
63
-
64
-
65
-
66
-
67
-
68
-
69
-
70
-
71
-
72
-
73
-
74
-
75
-
76
-
77
-
78
-
79
-
80
-
81
-
82
-
83
-
84
-
85
-
86
-
87
-
88
-
89
-
90
-
91
-
92
-
93
-
94
-
95
-
96
-
97
-
98
-
99
-
100
-
101
-
102
-
103
-
104
-
105
-
106
-
107
-
108
-
109
-
110
-
111
-
112
-
113
-
114
-
115
-
116
-
117
-
118
-
119
-
120
 |
 |

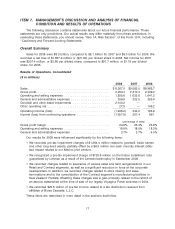
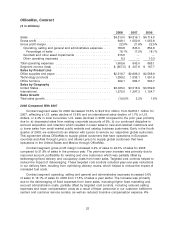
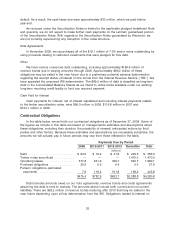
OfficeMax, Contract
($ in millions)
2008 2007 2006
Sales ............................................. $4,310.0 $4,816.1 $4,714.5
Gross profit ........................................ 948.1 1,050.9 1,062.8
Gross profit margin ................................... 22.0% 21.8% 22.5%
Operating, selling and general and administrative expenses .... 780.8 843.0 854.8
Percentage of sales ............................... 18.1% 17.5% 18.1%
Goodwill and other asset impairments ................... 815.5 — —
Other operating expenses ............................ 9.3 — 10.3
Total operating expenses .............................. 1,605.6 843.0 865.1
Segment income (loss) ................................ $ (657.5) $ 207.9 $ 197.7
Sales by Product Line
Office supplies and paper .............................. $2,518.7 $2,696.3 $2,568.9
Technology products ................................. 1,299.2 1,535.1 1,551.9
Office furniture ...................................... 492.1 584.7 593.7
Sales by Geography
United States ....................................... $3,035.0 $3,518.9 $3,559.8
International ........................................ 1,275.0 1,297.2 1,154.7
Sales Growth
Total sales growth .................................... (10.5)% 2.2% 1.9%
2008 Compared With 2007
Contract segment sales for 2008 decreased 10.5% to $4,310.0 million, from $4,816.1 million for
2007, reflecting a U.S. sales decline of 13.8% and an international sales decline of 1.7% in U.S.
dollars, or 2.4% in local currencies. U.S. sales declined in 2008 compared to the prior year primarily
due to: a) decreased sales from existing corporate accounts of 9%, b) our continued discipline in
account acquisition and retention which resulted in lower sales to new and retained customers and
c) lower sales from small market public website and catalog business customers. Early in the fourth
quarter of 2008, we entered into an alliance with Lyreco to service our respective global customers.
This agreement allows OfficeMax to supply global customers that have operations in European
countries and Asia through Lyreco, and allows Lyreco to supply global customers that have
operations in the United States and Mexico through OfficeMax.
Contract segment gross profit margin increased 0.2% of sales to 22.0% of sales for 2008
compared to 21.8% of sales in the previous year. The year-over-year increase was primarily due to
improved account profitability for existing and new customers which was partially offset by
deleveraging fixed delivery and occupancy costs from lower sales. Targeted cost controls helped to
reduce the impact of deleveraging. These targeted cost controls included year-over-year reductions
in our delivery fleet, resulting from optimizing delivery routes, which helped to reduce the impact of
increased fuel costs.
Contract segment operating, selling and general and administrative expenses increased 0.6%
of sales to 18.1% of sales for 2008 from 17.5% of sales a year earlier. The increase was primarily
due to the deleveraging of fixed expenses from lower sales, including higher fixed marketing and
account administration costs, partially offset by targeted cost controls, including reduced selling
expenses and lower compensation costs as a result of fewer personnel in our customer fulfillment
centers and customer service centers, as well as reduced incentive compensation expense. We
23