Nike 2003 Annual Report Download - page 62
Download and view the complete annual report
Please find page 62 of the 2003 Nike annual report below. You can navigate through the pages in the report by either clicking on the pages listed below, or by using the keyword search tool below to find specific information within the annual report.-
 1
1 -
2
-
3
-
4
-
5
-
6
-
7
-
8
-
9
-
10
-
11
-
12
-
13
-
14
-
15
-
16
-
17
-
18
-
19
-
20
-
21
-
22
-
23
-
24
-
25
-
26
-
27
-
28
-
29
-
30
-
31
-
32
-
33
-
34
-
35
-
36
-
37
-
38
-
39
-
40
-
41
-
42
-
43
-
44
-
45
-
46
-
47
-
48
-
49
-
50
-
51
-
 52
52 -
 53
53 -
 54
54 -
 55
55 -
 56
56 -
 57
57 -
 58
58 -
 59
59 -
 60
60 -
 61
61 -
 62
62 -
 63
63 -
 64
64 -
 65
65 -
 66
66 -
 67
67 -
 68
68 -
 69
69 -
 70
70 -
 71
71 -
 72
72 -
73
-
74
 |
 |

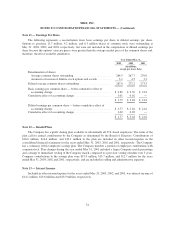
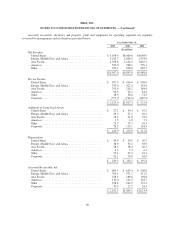
NIKE, INC.
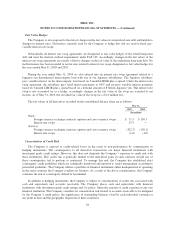
NOTES TO CONSOLIDATED FINANCIAL STATEMENTS — (Continued)
Year Ended May 31,
2003 2002 2001
(In millions)
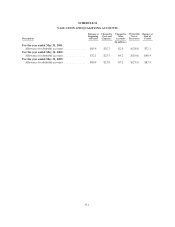
Inventory, net
United States ........................................ $ 640.6 $ 613.4 $ 701.4
Europe, Middle East, and Africa ......................... 383.4 336.5 298.3
Asia Pacific ......................................... 143.5 148.0 125.8
Americas ........................................... 84.2 62.9 72.4
Other .............................................. 253.1 203.8 199.2
Corporate ........................................... 10.1 9.2 27.0
$1,514.9 $1,373.8 $1,424.1
Property, Plant and Equipment, net
United States ........................................ $ 215.7 $ 241.9 $ 262.7
Europe, Middle East, and Africa ......................... 241.4 212.2 208.2
Asia Pacific ......................................... 386.3 378.4 403.5
Americas ........................................... 11.0 12.4 15.4
Other .............................................. 113.8 113.4 114.3
Corporate ........................................... 652.6 656.2 614.7
$1,620.8 $1,614.5 $1,618.8
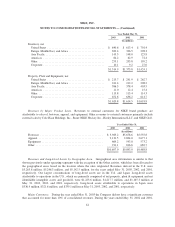
Revenues by Major Product Lines. Revenues to external customers for NIKE brand products are
attributable to sales of footwear, apparel, and equipment. Other revenues to external customers primarily include
external sales by Cole Haan Holdings, Inc., Bauer NIKE Hockey Inc., Hurley International LLC, and NIKE Golf.
Year Ended May 31,
2003 2002 2001
(In millions)
Footwear ............................................ $ 5,985.2 $5,678.6 $5,555.8
Apparel ............................................. 3,131.5 2,804.0 2,677.1
Equipment ........................................... 669.2 593.8 573.2
Other ............................................... 911.1 816.6 682.7
$10,697.0 $9,893.0 $9,488.8
Revenues and Long-Lived Assets by Geographic Area. Geographical area information is similar to that
shown previously under operating segments with the exception of the Other activity, which has been allocated to
the geographical areas based on the location where the sales originated. Revenues derived in the U.S. were
$5,263.8 million, $5,246.3 million, and $5,142.5 million, for the years ended May 31, 2003, 2002, and 2001,
respectively. Our largest concentrations of long-lived assets are in the U.S. and Japan. Long-lived assets
attributable to operations in the U.S., which are primarily comprised of net property, plant & equipment and net
identifiable intangible assets and goodwill, were $1,223.6 million, $1,217.7 million, and $1,165.3 million at
May 31, 2003, 2002, and 2001, respectively. Long-lived assets attributable to operations in Japan were
$336.4 million, $321.6 million, and $339.1 million at May 31, 2003, 2002, and 2001, respectively.
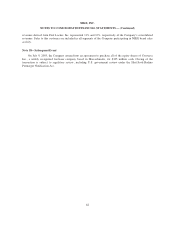
Major Customers. During the year ended May 31, 2003 the Company did not have a significant customer
that accounted for more than 10% of consolidated revenues. During the years ended May 31, 2002 and 2001,
61