Nike 2003 Annual Report Download - page 22
Download and view the complete annual report
Please find page 22 of the 2003 Nike annual report below. You can navigate through the pages in the report by either clicking on the pages listed below, or by using the keyword search tool below to find specific information within the annual report.-
 1
1 -
2
-
3
-
4
-
5
-
6
-
7
-
8
-
9
-
10
-
11
-
 12
12 -
 13
13 -
 14
14 -
 15
15 -
 16
16 -
 17
17 -
 18
18 -
 19
19 -
 20
20 -
 21
21 -
 22
22 -
 23
23 -
 24
24 -
 25
25 -
 26
26 -
 27
27 -
 28
28 -
 29
29 -
 30
30 -
 31
31 -
 32
32 -
33
-
34
-
35
-
36
-
37
-
38
-
39
-
40
-
41
-
42
-
43
-
44
-
45
-
46
-
47
-
48
-
49
-
50
-
51
-
52
-
53
-
54
-
55
-
56
-
57
-
58
-
59
-
60
-
61
-
62
-
63
-
64
-
65
-
66
-
67
-
68
-
69
-
70
-
71
-
72
-
73
-
74
 |
 |
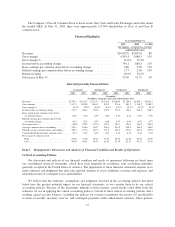
term, we do not expect to fully offset the revenue decline from Foot Locker in the U.S., and the amounts of future
sales to Foot Locker are uncertain. However, we believe the NIKE brand continues to enjoy strong consumer
demand and that we will successfully realign our distribution to fulfill consumers’ demand for our products and
generate profitable revenue growth.
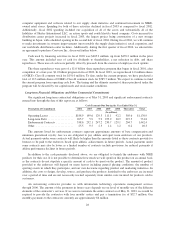
Our unit sales of footwear in the U.S. increased slightly as compared to fiscal 2002. However, this volume
increase was more than offset by a decline in the average price per pair of footwear sold. The reduction in
average price per pair in fiscal 2003 versus fiscal 2002 reflected a higher percentage of sales of classic footwear
and kids’ models, which have a lower average price than our more complex adult performance models. Based
upon futures orders, average price per pair ordered by customers for delivery in the first quarter of fiscal 2004
was slightly below the prior year, but the average price per pair increased for second quarter orders.
U.S. region pre-tax income increased from $956.0 million in fiscal 2002 to $957.5 million in fiscal 2003.
Pre-tax income improved, despite lower revenues and higher selling and administrative expense, due to improved
gross margins.
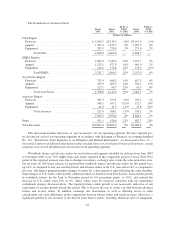
Other revenues include revenues from Bauer NIKE Hockey, Inc., Cole Haan Holdings, Inc., Hurley
International LLC, and NIKE Golf. In fiscal 2003, we began managing the NIKE Golf operations in our largest
golf markets separately from our regional businesses. As a result, beginning in the first quarter of fiscal 2003,
revenues and pre-tax income for these businesses have been excluded from the regional results and reported in
the Other category. This NIKE Golf information for fiscal 2002 and fiscal 2001 has been reclassified in this
Form 10-K to conform to the fiscal 2003 presentation.
Other revenues grew 12% in fiscal 2003 compared to fiscal 2002. The addition of revenues from our Hurley
business, purchased in the fourth quarter of fiscal 2002, drove the increase in Other revenues.
Other pre-tax income declined from $56.8 million in fiscal 2002 to $18.9 million in fiscal 2003. Reduced
profitability at NIKE Golf drove this decline, reflecting significantly weaker demand in the U.S. golf market
versus fiscal 2002 and start-up issues we experienced at a third-party distribution facility. We expect that demand
in the U.S. for golf products throughout the industry and for our business may remain weak in the near term due
to the current slowdown of the U.S. economy.
21