Nike 2003 Annual Report Download - page 43
Download and view the complete annual report
Please find page 43 of the 2003 Nike annual report below. You can navigate through the pages in the report by either clicking on the pages listed below, or by using the keyword search tool below to find specific information within the annual report.-
 1
1 -
2
-
3
-
4
-
5
-
6
-
7
-
8
-
9
-
10
-
11
-
12
-
13
-
14
-
15
-
16
-
17
-
18
-
19
-
20
-
21
-
22
-
23
-
24
-
25
-
26
-
27
-
28
-
29
-
30
-
31
-
32
-
 33
33 -
 34
34 -
 35
35 -
 36
36 -
 37
37 -
 38
38 -
 39
39 -
 40
40 -
 41
41 -
 42
42 -
 43
43 -
 44
44 -
 45
45 -
 46
46 -
 47
47 -
 48
48 -
 49
49 -
 50
50 -
 51
51 -
 52
52 -
 53
53 -
54
-
55
-
56
-
57
-
58
-
59
-
60
-
61
-
62
-
63
-
64
-
65
-
66
-
67
-
68
-
69
-
70
-
71
-
72
-
73
-
74
 |
 |
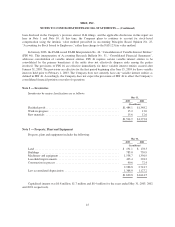
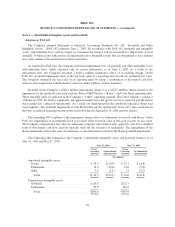
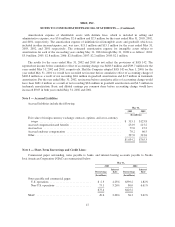
NIKE, INC.
NOTES TO CONSOLIDATED FINANCIAL STATEMENTS — (Continued)
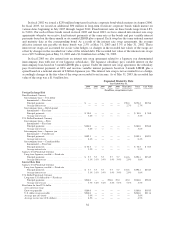
adjustment on the consolidated statement of income was a charge of $5.0 million, net of tax effect. This amount
related to an investment that was adjusted to fair value in accordance with FAS 133. The transition adjustment on
the consolidated balance sheet represented the initial recognition of the fair values of hedge derivatives
outstanding on the adoption date and realized gains and losses on effective hedges for which the underlying
exposure had not yet affected earnings. The transition adjustment on the consolidated balance sheet was an
increase in current assets of $116.4 million, an increase in noncurrent assets of $87.0 million, an increase in
current liabilities of $151.6 million, and an increase in other comprehensive income of approximately
$56.8 million, net of tax effect. The majority of the $56.8 million recorded in other comprehensive income as of
June 1, 2001 related to outstanding derivatives at that date. Because exchange rates on the transition date were
different from those on the maturity dates of these derivatives and because some contracts maturing during the
year ended May 31, 2002 were entered into after the transition date, amounts ultimately reclassified to earnings
during the year ended May 31, 2002, as described in Note 14, were significantly different from this amount.
Unrealized derivative gains and losses recorded in current and non-current assets and liabilities and amounts
recorded in other comprehensive income are non-cash items and therefore are taken into account in the
preparation of the consolidated statement of cash flows based on their respective balance sheet classifications.
See Note 16 for more information on our Risk Management program and Derivatives.
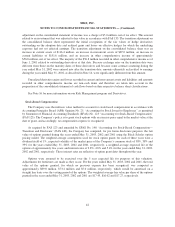
Stock-Based Compensation
The Company uses the intrinsic value method to account for stock-based compensation in accordance with
Accounting Principles Board (APB) Opinion No. 25, “Accounting for Stock Issued to Employees” as permitted
by Statement of Financial Accounting Standards (SFAS) No. 123 “Accounting for Stock-Based Compensation”
(FAS 123). The Company’s policy is to grant stock options with an exercise price equal to the market value at the
date of grant, and accordingly, no compensation expense is recognized.
As required by FAS 123 and amended by SFAS No. 148 “Accounting for Stock-Based Compensation—
Transition and Disclosure” (FAS 148), the Company has computed, for pro forma disclosure purposes, the fair
value of options granted during the years ended May 31, 2003, 2002 and 2001 using the Black-Scholes option
pricing model. The weighted average assumptions used for stock option grants for each of these years were a
dividend yield of 1%, expected volatility of the market price of the Company’s common stock of 38%, 38% and
39% for the years ended May 31, 2003, 2002 and 2001, respectively; a weighted-average expected life of the
options of approximately five years; and interest rates of 3.8%, 4.8% and 5.4% for the years ended May 31, 2003,
2002 and 2001, respectively. These interest rates are reflective of option grant dates throughout the year.
Options were assumed to be exercised over the 5 year expected life for purposes of this valuation.
Adjustments for forfeitures are made as they occur. For the years ended May 31, 2003, 2002 and 2001, the total
value of the options granted, for which no previous expense has been recognized, was computed as
approximately $89.8 million, $73.4 million and $5.0 million, respectively, which would be amortized on a
straight line basis over the vesting period of the options. The weighted average fair value per share of the options
granted in the years ended May 31, 2003, 2002 and 2001 are $17.45, $16.02 and $17.27, respectively.
42