Nike 2003 Annual Report Download - page 4
Download and view the complete annual report
Please find page 4 of the 2003 Nike annual report below. You can navigate through the pages in the report by either clicking on the pages listed below, or by using the keyword search tool below to find specific information within the annual report.
Our wholly-owned subsidiary Hurley International LLC, headquartered in Costa Mesa, California, designs
and distributes a line of action sports apparel (for surfing, skateboarding, and snowboarding) and youth lifestyle
apparel and footwear under the Hurley brand name.
On July 9, 2003, the Company entered into an agreement to purchase all of the equity shares of Converse
Inc., a widely recognized footwear company based in Massachusetts. Closing of the transaction is subject to
regulatory review, including U.S. government review under the Hart-Scott-Rodino Premerger Notification Act.
Sales and Marketing
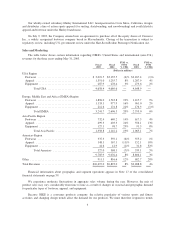
The table below shows certain information regarding NIKE’s United States and international (non-U.S.)
revenues for the three years ending May 31, 2003.
Fiscal
2003
Fiscal
2002
FY03 vs.
FY02
% CHG
Fiscal
2001
FY02 vs.
FY01
% CHG
(Dollars in millions)
USA Region
Footwear ..................................... $ 3,019.5 $3,135.5 (4)% $3,167.4 (1)%
Apparel ...................................... 1,351.0 1,255.7 8% 1,207.9 4%
Equipment .................................... 287.9 278.4 3% 273.6 2%
TotalUSA .............................. 4,658.4 4,669.6 — 4,648.9 —
Europe, Middle East and Africa (EMEA) Region
Footwear ..................................... 1,896.0 1,543.8 23% 1,415.7 9%
Apparel ...................................... 1,133.1 977.9 16% 961.0 2%
Equipment .................................... 212.6 174.8 22% 176.3 (1)%
TotalEMEA ............................ 3,241.7 2,696.5 20% 2,553.0 6%
Asia Pacific Region
Footwear ..................................... 732.4 640.2 14% 617.5 4%
Apparel ...................................... 499.3 403.3 24% 356.1 13%
Equipment .................................... 127.1 98.7 29% 91.5 8%
Total Asia Pacific ........................ 1,358.8 1,142.2 19% 1,065.1 7%
Americas Region
Footwear ..................................... 337.3 359.1 (6)% 355.2 1%
Apparel ...................................... 148.1 167.1 (11)% 152.1 10%
Equipment .................................... 41.6 41.9 (1)% 31.8 32%
Total Americas .......................... 527.0 568.1 (7)% 539.1 5%
9,785.9 9,076.4 8% 8,806.1 3%
Other .......................................... 911.1 816.6 12% 682.7 20%
TotalRevenues .................................. $10,697.0 $9,893.0 8% $9,488.8 4%
Financial information about geographic and segment operations appears in Note 17 of the consolidated
financial statements on page 59.
We experience moderate fluctuations in aggregate sales volume during the year. However, the mix of
product sales may vary considerably from time to time as a result of changes in seasonal and geographic demand
for particular types of footwear, apparel, and equipment.
Because NIKE is a consumer products company, the relative popularity of various sports and fitness
activities and changing design trends affect the demand for our products. We must therefore respond to trends
3

