Nike 2003 Annual Report Download - page 24
Download and view the complete annual report
Please find page 24 of the 2003 Nike annual report below. You can navigate through the pages in the report by either clicking on the pages listed below, or by using the keyword search tool below to find specific information within the annual report.-
 1
1 -
2
-
3
-
4
-
5
-
6
-
7
-
8
-
9
-
10
-
11
-
12
-
13
-
 14
14 -
 15
15 -
 16
16 -
 17
17 -
 18
18 -
 19
19 -
 20
20 -
 21
21 -
 22
22 -
 23
23 -
 24
24 -
 25
25 -
 26
26 -
 27
27 -
 28
28 -
 29
29 -
 30
30 -
 31
31 -
 32
32 -
 33
33 -
 34
34 -
35
-
36
-
37
-
38
-
39
-
40
-
41
-
42
-
43
-
44
-
45
-
46
-
47
-
48
-
49
-
50
-
51
-
52
-
53
-
54
-
55
-
56
-
57
-
58
-
59
-
60
-
61
-
62
-
63
-
64
-
65
-
66
-
67
-
68
-
69
-
70
-
71
-
72
-
73
-
74
 |
 |
U.S. licensed team apparel, Bauer NIKE Hockey, Cole Haan, NIKE Golf, Hurley, and retail sales across all
brands.
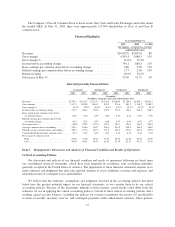
In fiscal 2003, our consolidated gross margin percentage improved 1.7 points as compared to fiscal 2002,
from 39.3% to 41.0%. Significant factors contributing to the improved gross margin percentage were as follows:
(1) Product cost reductions resulting from our global initiatives to improve efficiency and reduce
materials costs.
(2) A higher mix of sales of classic footwear models which are generally more profitable than our
more complex performance models.
Lower pricing of NIKE Golf products as a result of market conditions discussed above partially offset these
positive margin drivers. Changes in currency exchange rates did not have a material impact on our gross margin
percentage in fiscal 2003 as the benefit of stronger hedge rates in some currencies was offset by weaker hedge
rates in other currencies. A significant portion of product purchases for fiscal 2004 are already hedged and we
expect that changes in year-over-year hedge rates will have a net positive effect on our gross margin percentage
in fiscal 2004, as the benefits of stronger euro hedge rates more than offset weaker hedge rates in other
currencies.
Selling and administrative expense increased as a percentage of revenues from 28.5% in fiscal 2002 to
29.3% in fiscal 2003. Both demand creation and operating overhead expense increased as a percentage of
revenues. Demand creation expense grew from $1,027.9 million in fiscal 2002 to $1,168.6 million in fiscal 2003.
Higher costs incurred in the EMEA region drove the growth in demand creation expense, reflecting, 1) a stronger
euro currency exchange rate compared to the U.S. dollar, which resulted in higher U.S. dollar expenses for costs
that are euro-denominated, 2) our new endorsement agreement with the Manchester United soccer team that
became effective in August 2002, and 3) costs of our World Cup marketing campaign incurred in the first quarter
of fiscal 2003. Higher demand creation expenses were also incurred in the Asia Pacific and Americas regions due
to the World Cup marketing campaign. We also increased demand creation spending in the U.S. in order to drive
continued consumer demand for footwear while we realign our distribution to retail customers.
Operating overhead increased from $1,792.5 million in fiscal 2002 to $1,969.0 million in fiscal 2003. Major
drivers of this increase were the stronger euro exchange rate, incremental costs related to our on-going
development of systems and processes supporting our worldwide supply chain, (primarily reflected in the
corporate line in our segment presentation of pre-tax income in Note 17 — Operating Segments and Related
Information), investments in headcount for our NIKE Golf business, the addition of Hurley overhead costs
beginning in the fourth quarter of fiscal 2002, and overhead costs of additional retail stores in EMEA and Asia
Pacific.
As part of our worldwide supply chain initiative, we implemented new systems in the EMEA region in
fiscal 2003. Prior to the EMEA region implementation, we implemented new systems and processes for certain
global functions and for our U.S. and Canadian businesses. Over the next few years, we will continue to enhance
and refine the systems and processes in the U.S., EMEA and Canada as well as implement our new supply chain
platform in the remaining countries in which we operate. Over this time period, operating overhead expense will
continue to include costs of the supply chain initiative as well as costs for supporting our existing system
infrastructure for those businesses where we have not yet implemented the new systems. This initiative is
intended to improve revenue (by increasing our ability to respond to market conditions), margins (by lowering
close-outs and distribution costs) and cash flow (by reducing inventories). In the U.S., where the new systems
have been in place for over a year, we have begun to see improvements in several key performance measures.
The ultimate level of benefit, if any, to revenues, margins, and cash flows will not be known until the new
systems and processes have been implemented in the remaining countries in which we operate and globally
integrated over the next few years.
Interest expense decreased from $47.6 million in fiscal 2002 to $42.9 million in fiscal 2003, a decline of
10%. The decrease reflected both lower interest rates and lower average debt levels, as we have used cash flow
from operations to reduce total debt.
23