Nike 2003 Annual Report Download - page 21
Download and view the complete annual report
Please find page 21 of the 2003 Nike annual report below. You can navigate through the pages in the report by either clicking on the pages listed below, or by using the keyword search tool below to find specific information within the annual report.-
 1
1 -
2
-
3
-
4
-
5
-
6
-
7
-
8
-
9
-
10
-
 11
11 -
 12
12 -
 13
13 -
 14
14 -
 15
15 -
 16
16 -
 17
17 -
 18
18 -
 19
19 -
 20
20 -
 21
21 -
 22
22 -
 23
23 -
 24
24 -
 25
25 -
 26
26 -
 27
27 -
 28
28 -
 29
29 -
 30
30 -
 31
31 -
32
-
33
-
34
-
35
-
36
-
37
-
38
-
39
-
40
-
41
-
42
-
43
-
44
-
45
-
46
-
47
-
48
-
49
-
50
-
51
-
52
-
53
-
54
-
55
-
56
-
57
-
58
-
59
-
60
-
61
-
62
-
63
-
64
-
65
-
66
-
67
-
68
-
69
-
70
-
71
-
72
-
73
-
74
 |
 |
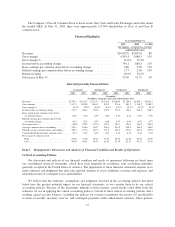
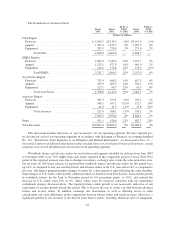
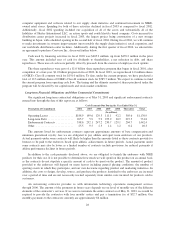
Our largest international region, Europe, Middle East and Africa (EMEA), reported 20% revenue growth in
fiscal 2003 compared to fiscal 2002. This growth reflected a 15 percentage point improvement due to changes in
currency exchange rates. Growth in the emerging markets in Central and Eastern Europe was the key driver of
the balance of the increase, as our distribution continued to expand in these markets and customer demand
increased. Excluding the effect from changes in currency exchange rates, each of our EMEA business units,
footwear, apparel, and equipment, delivered revenue growth versus the prior year.
EMEA pre-tax income grew from $422.4 million in fiscal 2002 to $533.0 million in fiscal 2003. Higher
revenues and improved gross margins drove the increase, more than offsetting incremental selling and
administrative costs.
In Asia Pacific, revenues increased 19% in fiscal 2003; five percentage points of this growth were due to
changes in currency exchange rates. Excluding the benefit from changes in currency exchange rates, sales in each
Asia Pacific business unit grew in fiscal 2003, as did sales in almost every country of the region, particularly
Japan and Korea, driven primarily by heightened consumer demand for our products following the 2002 World
Cup and our related marketing campaign, and China, driven primarily by an expansion of retail distribution of
our products.
Pre-tax income for the Asia Pacific region increased from $216.2 million in fiscal 2002 to $295.0 million in
fiscal 2003. This increase reflected higher revenues and improved gross margins that more than offset higher
selling and administrative costs.
In the Americas region, fiscal 2003 revenues decreased 7% compared to fiscal 2002, reflecting higher sales
in local currencies that were more than offset by a 15 percentage point decline due to changes in currency
exchange rates. This currency exchange impact was due to weaker currencies in the Latin American markets,
partially offset by the stronger Canadian dollar. Excluding the currency exchange rate impact, the region
experienced sales growth in the footwear and equipment business units slightly offset by a small percentage
decrease in the apparel business unit. On a geographic basis, excluding currency exchange rate impacts, the
region experienced sales growth in Brazil, Argentina, and Mexico, reflecting stronger consumer demand. The
sales growth in Argentina reflected a rebound since fiscal 2002 when that country underwent an economic crisis.
Pre-tax income for the Americas region grew from $92.1 million in fiscal 2002 to $96.3 million in fiscal
2003. Pre-tax income improved despite lower reported revenues primarily due to an improved gross margin
percentage.
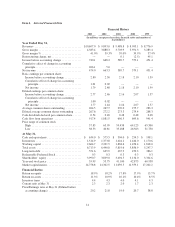
In the U.S. region, revenues were down slightly in fiscal 2003, at $4,658.4 million versus $4,669.6 million
in fiscal 2002. U.S. footwear revenues were down 4%, more than offsetting sales growth in U.S. apparel and
equipment. U.S. apparel sales increased $95.3 million dollars, primarily driven by increased consumer demand
for team licensed apparel. Lower revenues in the footwear business unit were largely the result of a significant
change in our U.S. footwear distribution.
During fiscal 2003, we began a realignment of our U.S. footwear distribution to address the changing retail
marketplace, including our largest customer’s (Foot Locker) reduction in emphasis on premium footwear in its
offerings. The objectives of this realignment are to improve the presentation and profitability of the NIKE brand
in the U.S. As a result of changes in both Foot Locker’s orders and our product offerings to this account, our
fiscal 2003 sales to Foot Locker in the U.S. were significantly below the level of fiscal 2002. At the same time,
we expanded the premium products available to other athletic specialty and independent retailers that focus on
premium footwear offerings, increasing sales to these accounts significantly.
Based upon U.S. futures orders scheduled for delivery through December 2003, we expect that U.S.
footwear revenues will remain below prior year levels at least through the first half of fiscal 2004. In the short
20