Nike 2003 Annual Report Download - page 26
Download and view the complete annual report
Please find page 26 of the 2003 Nike annual report below. You can navigate through the pages in the report by either clicking on the pages listed below, or by using the keyword search tool below to find specific information within the annual report.-
 1
1 -
2
-
3
-
4
-
5
-
6
-
7
-
8
-
9
-
10
-
11
-
12
-
13
-
14
-
15
-
 16
16 -
 17
17 -
 18
18 -
 19
19 -
 20
20 -
 21
21 -
 22
22 -
 23
23 -
 24
24 -
 25
25 -
 26
26 -
 27
27 -
 28
28 -
 29
29 -
 30
30 -
 31
31 -
 32
32 -
 33
33 -
 34
34 -
 35
35 -
 36
36 -
37
-
38
-
39
-
40
-
41
-
42
-
43
-
44
-
45
-
46
-
47
-
48
-
49
-
50
-
51
-
52
-
53
-
54
-
55
-
56
-
57
-
58
-
59
-
60
-
61
-
62
-
63
-
64
-
65
-
66
-
67
-
68
-
69
-
70
-
71
-
72
-
73
-
74
 |
 |
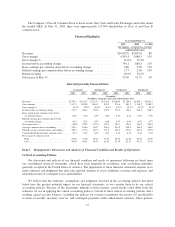
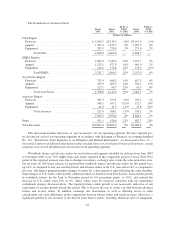
In the U.S. region, revenues were flat in fiscal 2002 versus fiscal 2001, reflecting increased sales of apparel
and equipment offset by decreased sales of footwear. The increased sales in apparel reflected higher demand for
in-line products, particularly for NIKE brand and Brand Jordan basketball apparel, more than offsetting the effect
of the expiration of our apparel license agreement with the National Football League in fiscal 2001. While in-line
sales of footwear increased in fiscal 2002, particularly in the mid-range price segment, close-out sales decreased
significantly. The reduction in close-out sales reflected both our efforts to limit the availability of close-out
products in the marketplace (in order to build overall profitability) and relatively high levels of close-out sales in
the last half of fiscal 2001 due to supply chain system disruptions. As in the apparel business, sales of NIKE
brand and Brand Jordan basketball footwear products were the primary drivers of increased wholesale sales of
in-line footwear during the year.
Despite revenues and selling and administrative expense being essentially consistent with fiscal 2001, U.S.
pre-tax income increased from $905.0 million to $956.0 million, driven primarily by an improved gross margin
percentage.
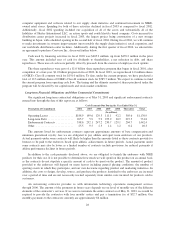
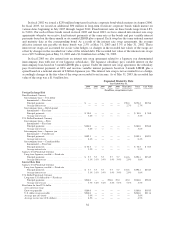
In fiscal 2002, revenues from our international regions grew 6% versus the prior year. Changes in currency
exchange rates decreased the international region growth rate 6 percentage points and decreased our consolidated
growth rate 3 percentage points. Fiscal 2002 reported revenues in EMEA increased by 6% over fiscal 2001,
including a 4 percentage point decrease due to changes in currency exchange rates. Excluding the negative effect
of currency exchange rates, EMEA revenues grew in each of our business units, footwear, apparel, and
equipment and in almost every country in the region, reflecting increasing demand for NIKE brand products
throughout EMEA.
EMEA pre-tax income grew 16% from $363.4 million to $422.4 million. Growth in revenues and a higher
gross margin percentage drove the increase in pre-tax income.
In our Asia Pacific region, reported revenues grew 7%, including a 10 percentage point decrease due to
changes in currency exchange rates. Asia Pacific revenues grew in each business unit and in almost every
country in the region, with the largest growth coming from Japan, Korea, and China.
Pre-tax income for the Asia Pacific region increased from $184.4 million to $216.2 million. The increase in
revenues and lower selling and administrative expense as a percentage of revenues drove the growth in pre-tax
income, which was partially offset by a decline in gross margin percentage.
The Americas region reported revenues grew 5%, including a 7 percentage point decrease due to changes in
currency exchange rates, despite a drop-off in sales in Argentina during the second half of fiscal 2002 as a result
of the country’s economic crisis. Revenues in the Americas region grew in each of our business units, led by
growth in Canada, Mexico, and Brazil.
Pre-tax income for the Americas region increased from $81.6 million to $92.1 million. The increase in
revenues and lower selling and administrative expense as a percentage of revenues drove the growth in pre-tax
income, which was partially offset by a decline in gross margin percentage.
In fiscal 2002, Other revenues, including revenues from Bauer NIKE Hockey, Cole Haan, Hurley, and
NIKE Golf, increased 20% to $816.6 million, driven by growth in NIKE Golf. The Hurley acquisition did not
have a significant impact on fiscal 2002 revenues since the acquisition did not occur until the last quarter of fiscal
2002.
Other pre-tax income declined from $74.2 million to $56.8 million, driven by a decline in profitability at
Cole Haan. Despite slight revenue growth at Cole Haan during the year, pre-tax income declined due to relatively
high discounting and inventory obsolescence as a result of depressed consumer demand in the wake of the
September 11, 2001 terrorist attacks.
25