Nike 2003 Annual Report Download - page 23
Download and view the complete annual report
Please find page 23 of the 2003 Nike annual report below. You can navigate through the pages in the report by either clicking on the pages listed below, or by using the keyword search tool below to find specific information within the annual report.-
 1
1 -
2
-
3
-
4
-
5
-
6
-
7
-
8
-
9
-
10
-
11
-
12
-
 13
13 -
 14
14 -
 15
15 -
 16
16 -
 17
17 -
 18
18 -
 19
19 -
 20
20 -
 21
21 -
 22
22 -
 23
23 -
 24
24 -
 25
25 -
 26
26 -
 27
27 -
 28
28 -
 29
29 -
 30
30 -
 31
31 -
 32
32 -
 33
33 -
34
-
35
-
36
-
37
-
38
-
39
-
40
-
41
-
42
-
43
-
44
-
45
-
46
-
47
-
48
-
49
-
50
-
51
-
52
-
53
-
54
-
55
-
56
-
57
-
58
-
59
-
60
-
61
-
62
-
63
-
64
-
65
-
66
-
67
-
68
-
69
-
70
-
71
-
72
-
73
-
74
 |
 |

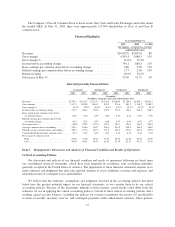
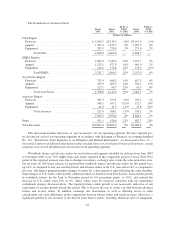
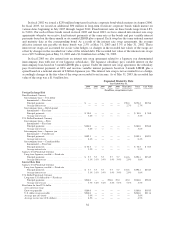
The breakdown of revenues follows:
Fiscal
2003
Fiscal
2002
FY03 vs.
FY02
% CHG
Fiscal
2001
FY02 vs.
FY01
% CHG
(Dollars in millions)
USA Region
Footwear ..................................... $ 3,019.5 $3,135.5 (4)% $3,167.4 (1)%
Apparel ...................................... 1,351.0 1,255.7 8% 1,207.9 4%
Equipment .................................... 287.9 278.4 3% 273.6 2%
TotalUSA.............................. 4,658.4 4,669.6 — 4,648.9 —
EMEA Region
Footwear ..................................... 1,896.0 1,543.8 23% 1,415.7 9%
Apparel ...................................... 1,133.1 977.9 16% 961.0 2%
Equipment .................................... 212.6 174.8 22% 176.3 (1)%
TotalEMEA ............................ 3,241.7 2,696.5 20% 2,553.0 6%
Asia Pacific Region
Footwear ..................................... 732.4 640.2 14% 617.5 4%
Apparel ...................................... 499.3 403.3 24% 356.1 13%
Equipment .................................... 127.1 98.7 29% 91.5 8%
Total Asia Pacific ........................ 1,358.8 1,142.2 19% 1,065.1 7%
Americas Region
Footwear ..................................... 337.3 359.1 (6)% 355.2 1%
Apparel ...................................... 148.1 167.1 (11)% 152.1 10%
Equipment .................................... 41.6 41.9 (1)% 31.8 32%
Total Americas .......................... 527.0 568.1 (7)% 539.1 5%
9,785.9 9,076.4 8% 8,806.1 3%
Other .......................................... 911.1 816.6 12% 682.7 20%
TotalRevenues .................................. $10,697.0 $9,893.0 8% $9,488.8 4%
This discussion includes disclosure of “pre-tax income” for our operating segments. We have reported pre-
tax income for each of our operating segments in accordance with Statement of Financial Accounting Standard
No. 131, “Disclosures about Segments of an Enterprise and Related Information.” As discussed in Note 17 —
Operating Segments and Related Information in the attached Notes to Consolidated Financial Statements, certain
corporate costs are not included in pre-tax income of our operating segments.
Worldwide futures and advance orders for our footwear and apparel scheduled for delivery from June 2003
to November 2003 were 5.0% higher than such orders reported in the comparable period of fiscal 2002. Five
points of this reported increase were due to changes in currency exchange rates versus the same period last year.
On our June 26, 2003 press release, we reported that worldwide futures and advance orders for this period were
up 4.4% as compared to last year and that futures and advance orders in the U.S. were down 10% as compared to
last year. Our futures program permits changes to orders for a short period of time following the order deadline.
Such changes to U.S. orders, most notably additional orders of footwear from Foot Locker, increased the growth
in worldwide futures for the June to November period by 0.6 percentage points, to 5.0%, and reduced the
decrease in U.S. orders from 10% to 9%. These orders were for footwear consistent with our distribution
realignment strategy discussed above. The reported futures orders growth is not necessarily indicative of our
expectation of revenue growth during this period. This is because the mix of orders can shift between advance/
futures and at-once orders. In addition, exchange rate fluctuations as well as differing levels of order
cancellations can cause differences in the comparisons between futures orders and actual revenues. Moreover, a
significant portion of our revenues is not derived from futures orders, including wholesale sales of equipment,
22