Nike 2003 Annual Report Download - page 61
Download and view the complete annual report
Please find page 61 of the 2003 Nike annual report below. You can navigate through the pages in the report by either clicking on the pages listed below, or by using the keyword search tool below to find specific information within the annual report.-
 1
1 -
2
-
3
-
4
-
5
-
6
-
7
-
8
-
9
-
10
-
11
-
12
-
13
-
14
-
15
-
16
-
17
-
18
-
19
-
20
-
21
-
22
-
23
-
24
-
25
-
26
-
27
-
28
-
29
-
30
-
31
-
32
-
33
-
34
-
35
-
36
-
37
-
38
-
39
-
40
-
41
-
42
-
43
-
44
-
45
-
46
-
47
-
48
-
49
-
50
-
 51
51 -
 52
52 -
 53
53 -
 54
54 -
 55
55 -
 56
56 -
 57
57 -
 58
58 -
 59
59 -
 60
60 -
 61
61 -
 62
62 -
 63
63 -
 64
64 -
 65
65 -
 66
66 -
 67
67 -
 68
68 -
 69
69 -
 70
70 -
 71
71 -
72
-
73
-
74
 |
 |

NIKE, INC.
NOTES TO CONSOLIDATED FINANCIAL STATEMENTS — (Continued)
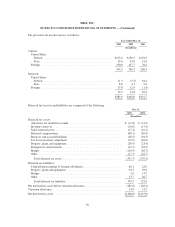
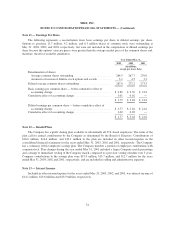
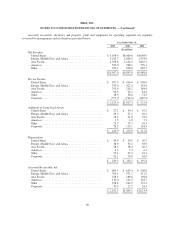
Accounts receivable, inventory and property, plant and equipment for operating segments are regularly
reviewed by management and are therefore provided below.
Year Ended May 31,
2003 2002 2001
(In millions)
Net Revenue
United States ....................................... $ 4,658.4 $4,669.6 $4,648.9
Europe, Middle East, and Africa ........................ 3,241.7 2,696.5 2,553.0
Asia Pacific ........................................ 1,358.8 1,142.2 1,065.1
Americas .......................................... 527.0 568.1 539.1
Other ............................................. 911.1 816.6 682.7
$10,697.0 $9,893.0 $9,488.8
Pre-tax Income
United States ....................................... $ 957.5 $ 956.0 $ 905.0
Europe, Middle East, and Africa ........................ 533.0 422.4 363.4
Asia Pacific ........................................ 295.0 216.2 184.4
Americas .......................................... 96.3 92.1 81.6
Other ............................................. 18.9 56.8 74.2
Corporate .......................................... (777.7) (726.2) (687.2)
$ 1,123.0 $1,017.3 $ 921.4
Additions to Long-lived Assets
United States ....................................... $ 27.1 $ 30.4 $ 45.2
Europe, Middle East, and Africa ........................ 29.2 27.2 26.2
Asia Pacific ........................................ 26.2 21.8 52.9
Americas .......................................... 3.5 4.8 5.1
Other ............................................. 23.7 79.7 26.3
Corporate .......................................... 76.2 115.1 161.9
$ 185.9 $ 279.0 $ 317.6
Depreciation
United States ....................................... $ 49.9 $ 50.5 $ 50.7
Europe, Middle East, and Africa ........................ 38.9 35.2 38.9
Asia Pacific ........................................ 38.5 38.4 20.5
Americas .......................................... 4.5 5.3 6.3
Other ............................................. 25.4 23.3 24.1
Corporate .......................................... 82.1 70.8 56.9
$ 239.3 $ 223.5 $ 197.4
Accounts Receivable, net
United States ....................................... $ 609.5 $ 654.4 $ 569.0
Europe, Middle East, and Africa ........................ 794.1 571.1 512.5
Asia Pacific ........................................ 258.4 189.6 194.8
Americas .......................................... 130.0 122.3 144.7
Other ............................................. 278.8 249.5 172.1
Corporate .......................................... 30.3 17.2 28.3
$ 2,101.1 $1,804.1 $1,621.4
60