Nike 2003 Annual Report Download - page 16
Download and view the complete annual report
Please find page 16 of the 2003 Nike annual report below. You can navigate through the pages in the report by either clicking on the pages listed below, or by using the keyword search tool below to find specific information within the annual report.-
 1
1 -
2
-
3
-
4
-
5
-
 6
6 -
 7
7 -
 8
8 -
 9
9 -
 10
10 -
 11
11 -
 12
12 -
 13
13 -
 14
14 -
 15
15 -
 16
16 -
 17
17 -
 18
18 -
 19
19 -
 20
20 -
 21
21 -
 22
22 -
 23
23 -
 24
24 -
 25
25 -
 26
26 -
27
-
28
-
29
-
30
-
31
-
32
-
33
-
34
-
35
-
36
-
37
-
38
-
39
-
40
-
41
-
42
-
43
-
44
-
45
-
46
-
47
-
48
-
49
-
50
-
51
-
52
-
53
-
54
-
55
-
56
-
57
-
58
-
59
-
60
-
61
-
62
-
63
-
64
-
65
-
66
-
67
-
68
-
69
-
70
-
71
-
72
-
73
-
74
 |
 |

The Company’s Class B Common Stock is listed on the New York and Pacific Exchanges and trades under
the symbol NKE. At May 31, 2003, there were approximately 127,000 shareholders of Class A and Class B
common stock.
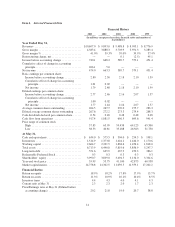
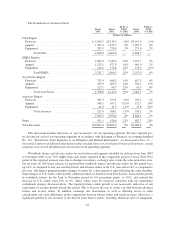
Financial Highlights
Year Ended May 31,
2003 2002 % CHG
(In millions, except per share data
and financial ratios)
Revenues ........................................................ $10,697.0 $9,893.0 8%
Grossmargin ..................................................... 4,383.4 3,888.3 13%
Grossmargin% ................................................... 41.0% 39.3%
Incomebeforeaccountingchange ..................................... 740.1 668.3 11%
Basic earnings per common share before accounting change ................ 2.80 2.50 12%
Diluted earnings per common share before accounting change .............. 2.77 2.46 13%
Returnonequity................................................... 18.9% 18.2%
Stock price at May 31 .............................................. 55.99 53.75 4%
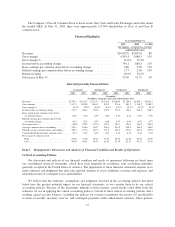
Selected Quarterly Financial Data
1st Quarter 2nd Quarter 3rd Quarter 4th Quarter
2003 2002 2003 2002 2003 2002 2003 2002
(Unaudited)
(In millions, except per share data and financial ratios)
Revenues.............................. $2,796.3 $2,613.7 $2,514.7 $2,336.8 $2,400.9 $2,260.3 $2,985.1 $2,682.2
Grossmargin........................... 1,157.1 1,028.9 1,010.1 895.4 976.0 883.5 1,240.2 1,080.5
Grossmargin%......................... 41.4% 39.4% 40.2% 38.3% 40.7% 39.1% 41.5% 40.3%
Incomebeforeaccountingchange .......... 217.2 204.2 152.0 129.3 124.7 126.3 246.2 208.5
Basic earnings per common share before
accountingchange..................... 0.82 0.76 0.57 0.48 0.47 0.47 0.93 0.78
Diluted earnings per common share before
accountingchange..................... 0.81 0.75 0.57 0.48 0.47 0.46 0.92 0.77
Netincome(loss) ....................... (48.9) 199.2 152.0 129.3 124.7 126.3 246.2 208.5
Average common shares outstanding ........ 265.3 268.6 264.7 268.1 263.9 268.4 264.0 266.9
Diluted average common shares outstanding . . 269.1 271.6 267.5 271.6 266.7 273.4 267.6 272.0
Cash dividends declared per common share . . . 0.12 0.12 0.14 0.12 0.14 0.12 0.14 0.12
Price range of common stock
High................................ 57.85 51.28 48.23 53.55 48.43 61.00 56.56 63.99
Low ................................ 40.50 40.81 38.53 42.26 41.19 52.31 45.51 52.75
Item 7. Management’s Discussion and Analysis of Financial Condition and Results of Operations
Critical Accounting Policies
Our discussion and analysis of our financial condition and results of operations following are based upon
our consolidated financial statements, which have been prepared in accordance with accounting principles
generally accepted in the United States of America. The preparation of these financial statements requires us to
make estimates and judgments that affect the reported amounts of assets, liabilities, revenues and expenses, and
related disclosure of contingent assets and liabilities.
We believe that the estimates, assumptions and judgments involved in the accounting policies described
below have the greatest potential impact on our financial statements, so we consider these to be our critical
accounting policies. Because of the uncertainty inherent in these matters, actual results could differ from the
estimates we use in applying the critical accounting policies. Certain of these critical accounting policies affect
working capital account balances, including the policies for revenue recognition, the reserve for uncollectible
accounts receivable, inventory reserves, and contingent payments under endorsement contracts. These policies
15