Nike 2003 Annual Report Download - page 15
Download and view the complete annual report
Please find page 15 of the 2003 Nike annual report below. You can navigate through the pages in the report by either clicking on the pages listed below, or by using the keyword search tool below to find specific information within the annual report.-
 1
1 -
2
-
3
-
4
-
 5
5 -
 6
6 -
 7
7 -
 8
8 -
 9
9 -
 10
10 -
 11
11 -
 12
12 -
 13
13 -
 14
14 -
 15
15 -
 16
16 -
 17
17 -
 18
18 -
 19
19 -
 20
20 -
 21
21 -
 22
22 -
 23
23 -
 24
24 -
 25
25 -
26
-
27
-
28
-
29
-
30
-
31
-
32
-
33
-
34
-
35
-
36
-
37
-
38
-
39
-
40
-
41
-
42
-
43
-
44
-
45
-
46
-
47
-
48
-
49
-
50
-
51
-
52
-
53
-
54
-
55
-
56
-
57
-
58
-
59
-
60
-
61
-
62
-
63
-
64
-
65
-
66
-
67
-
68
-
69
-
70
-
71
-
72
-
73
-
74
 |
 |

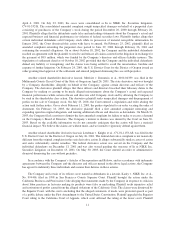
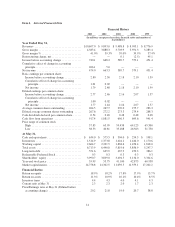
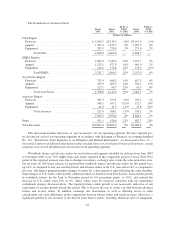
Item 6. Selected Financial Data
Financial History
2003 2002 2001 2000 1999
(In millions, except per share data, financial ratios and number of
shareholders)
Year Ended May 31,
Revenues ................................. $10,697.0 $ 9,893.0 $ 9,488.8 $ 8,995.1 $ 8,776.9
Grossmargin .............................. 4,383.4 3,888.3 3,703.9 3,591.3 3,283.4
Grossmargin%............................ 41.0% 39.3% 39.0% 39.9% 37.4%
Restructuring charge, net ..................... — — 0.1 (2.5) 45.1
Incomebeforeaccountingchange.............. 740.1 668.3 589.7 579.1 451.4
Cumulative effect of change in accounting
principle................................ 266.1 5.0 — — —
Netincome ............................... 474.0 663.3 589.7 579.1 451.4
Basic earnings per common share:
Incomebeforeaccountingchange............ 2.80 2.50 2.18 2.10 1.59
Cumulative effect of change in accounting
principle.............................. 1.01 0.02 — — —
Netincome ............................. 1.79 2.48 2.18 2.10 1.59
Diluted earnings per common share:
Incomebeforeaccountingchange............ 2.77 2.46 2.16 2.07 1.57
Cumulative effect of change in accounting
principle.............................. 1.00 0.02 — — —
Netincome ............................. 1.77 2.44 2.16 2.07 1.57
Average common shares outstanding ........... 264.5 267.7 270.0 275.7 283.3
Diluted average common shares outstanding ..... 267.6 272.2 273.3 279.4 288.3
Cash dividends declared per common share ...... 0.54 0.48 0.48 0.48 0.48
Cash flow from operations ................... 917.4 1,081.5 656.5 699.6 941.4
Price range of common stock
High................................... 57.85 63.99 59.438 64.125 65.500
Low ................................... 38.53 40.81 35.188 26.563 31.750
At May 31,
Cash and equivalents ........................ $ 634.0 $ 575.5 $ 304.0 $ 254.3 $ 198.1
Inventories ................................ 1,514.9 1,373.8 1,424.1 1,446.0 1,170.6
Working capital ............................ 2,664.7 2,321.5 1,838.6 1,456.4 1,818.0
Total assets ............................... 6,713.9 6,440.0 5,819.6 5,856.9 5,247.7
Long-term debt ............................ 551.6 625.9 435.9 470.3 386.1
Redeemable Preferred Stock .................. 0.3 0.3 0.3 0.3 0.3
Shareholders’ equity ........................ 3,990.7 3,839.0 3,494.5 3,136.0 3,334.6
Year-end stock price ........................ 55.99 53.75 41.100 42.875 60.938
Market capitalization ........................ 14,758.8 14,302.5 11,039.5 11,559.1 17,202.2
Financial Ratios:
Returnonequity ........................... 18.9% 18.2% 17.8% 17.9% 13.7%
Return on assets ............................ 11.3% 10.9% 10.1% 10.4% 8.5%
Inventoryturns ............................ 4.4 4.3 4.0 4.1 4.3
Current ratio at May 31 ...................... 2.3 2.3 2.0 1.7 2.3
Price/Earnings ratio at May 31 (Diluted before
accountingchange) ....................... 20.2 21.8 19.0 20.7 38.8
14