NetSpend 2011 Annual Report Download - page 99
Download and view the complete annual report
Please find page 99 of the 2011 NetSpend annual report below. You can navigate through the pages in the report by either clicking on the pages listed below, or by using the keyword search tool below to find specific information within the annual report.-
 1
1 -
2
-
3
-
4
-
5
-
6
-
7
-
8
-
9
-
10
-
11
-
12
-
13
-
14
-
15
-
16
-
17
-
18
-
19
-
20
-
21
-
22
-
23
-
24
-
25
-
26
-
27
-
28
-
29
-
30
-
31
-
32
-
33
-
34
-
35
-
36
-
37
-
38
-
39
-
40
-
41
-
42
-
43
-
44
-
45
-
46
-
47
-
48
-
49
-
50
-
51
-
52
-
53
-
54
-
55
-
56
-
57
-
58
-
59
-
60
-
61
-
62
-
63
-
64
-
65
-
66
-
67
-
68
-
69
-
70
-
71
-
72
-
73
-
74
-
75
-
76
-
77
-
78
-
79
-
80
-
81
-
82
-
83
-
84
-
85
-
86
-
87
-
88
-
 89
89 -
 90
90 -
 91
91 -
 92
92 -
 93
93 -
 94
94 -
 95
95 -
 96
96 -
 97
97 -
 98
98 -
 99
99 -
 100
100 -
 101
101 -
 102
102 -
 103
103 -
 104
104 -
 105
105 -
 106
106 -
 107
107 -
 108
108 -
 109
109 -
110
-
111
-
112
-
113
-
114
-
115
-
116
-
117
-
118
-
119
-
120
-
121
-
122
-
123
-
124
-
125
-
126
-
127
-
128
-
129
-
130
-
131
-
132
-
133
-
134
-
135
-
136
-
137
-
138
-
139
-
140
-
141
-
142
-
143
-
144
-
145
-
146
-
147
-
148
-
149
-
150
-
151
-
152
-
153
-
154
-
155
-
156
-
157
-
158
-
159
-
160
-
161
-
162
-
163
-
164
-
165
-
166
-
167
-
168
-
169
-
170
-
171
-
172
-
173
 |
 |

Table of Contents
NetSpend Holdings, Inc.
Notes to Consolidated Financial Statements (Continued)
December 31, 2011, 2010 and 2009
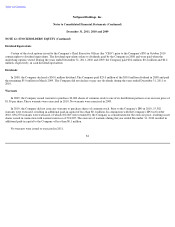
NOTE 14: COMPREHENSIVE INCOME (Continued)
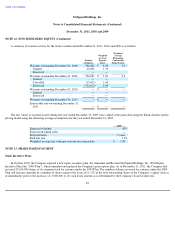
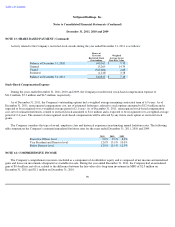
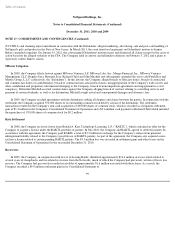
The following table presents the calculation of comprehensive income:
NOTE 15: EARNINGS PER SHARE
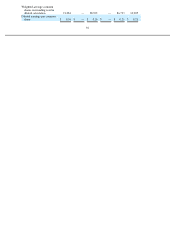
Basic earnings per common share is calculated by dividing net income available to common stockholders by the number of weighted
average common shares issued and outstanding for the period. The Company calculates basic and diluted earnings per share using the treasury
stock method, the if-converted method and the two-class method, as applicable.
Upon completion of the Company's IPO in October 2010, all shares of class A common stock were reclassified as common stock. In
addition, promptly following the IPO, all shares of the Company's class B common stock were transferred to members of Skylight Holdings
I, LLC, which had the effect of converting them into shares of common stock on a one-for-one basis. For the year ended December 31, 2010
the as-if converted method was applied and so the conversion of the class B common stock into common stock was reflected as of the
beginning of the reporting period. Only one class of common stock and one class of preferred stock existed during the year ended
December 31, 2011.
Certain of the CEO's stock options contain rights to dividend equivalents. These options, as well as the outstanding shares of Series A
Stock, are considered participating securities. In calculating basic earnings per share using the two-class method, earnings available to
participating securities are excluded from net income available to common shareholders.
Diluted earnings per common share is calculated by dividing net income available to common stockholders by the weighted average
number of common shares issued and outstanding for the period plus amounts representing the dilutive effect of stock options, warrants,
restricted stock and the conversion of convertible preferred stock, as applicable. The Company calculates dilutive potential common shares
using the treasury stock method. This method assumes that the Company will use proceeds from the exercise of stock options and warrants to
repurchase shares of common stock to hold in its treasury stock reserves.
During the years ended December 31, 2011 and 2009, the potential dilutive effect of 1.9 million and 9.7 million stock options,
respectively, were excluded from the computation of diluted weighted average shares outstanding because they were antidilutive. During the
year end December 31, 2010, the potential dilutive effect of 0.6 million stock options were excluded from the computation of diluted weighted
average shares outstanding because they were anti-dilutive. These excluded options could potentially dilute earnings per share in the future.
91
Year Ended
December 31,
2011 2010
(in thousands of dollars)
Net income
$
33,246
$
22,732
Unrealized holding gain (loss) on investment, net of tax
430
(1,142
)
Comprehensive income
$
33,676
$
21,590