NetSpend 2011 Annual Report Download - page 44
Download and view the complete annual report
Please find page 44 of the 2011 NetSpend annual report below. You can navigate through the pages in the report by either clicking on the pages listed below, or by using the keyword search tool below to find specific information within the annual report.-
 1
1 -
2
-
3
-
4
-
5
-
6
-
7
-
8
-
9
-
10
-
11
-
12
-
13
-
14
-
15
-
16
-
17
-
18
-
19
-
20
-
21
-
22
-
23
-
24
-
25
-
26
-
27
-
28
-
29
-
30
-
31
-
32
-
33
-
 34
34 -
 35
35 -
 36
36 -
 37
37 -
 38
38 -
 39
39 -
 40
40 -
 41
41 -
 42
42 -
 43
43 -
 44
44 -
 45
45 -
 46
46 -
 47
47 -
 48
48 -
 49
49 -
 50
50 -
 51
51 -
 52
52 -
 53
53 -
 54
54 -
55
-
56
-
57
-
58
-
59
-
60
-
61
-
62
-
63
-
64
-
65
-
66
-
67
-
68
-
69
-
70
-
71
-
72
-
73
-
74
-
75
-
76
-
77
-
78
-
79
-
80
-
81
-
82
-
83
-
84
-
85
-
86
-
87
-
88
-
89
-
90
-
91
-
92
-
93
-
94
-
95
-
96
-
97
-
98
-
99
-
100
-
101
-
102
-
103
-
104
-
105
-
106
-
107
-
108
-
109
-
110
-
111
-
112
-
113
-
114
-
115
-
116
-
117
-
118
-
119
-
120
-
121
-
122
-
123
-
124
-
125
-
126
-
127
-
128
-
129
-
130
-
131
-
132
-
133
-
134
-
135
-
136
-
137
-
138
-
139
-
140
-
141
-
142
-
143
-
144
-
145
-
146
-
147
-
148
-
149
-
150
-
151
-
152
-
153
-
154
-
155
-
156
-
157
-
158
-
159
-
160
-
161
-
162
-
163
-
164
-
165
-
166
-
167
-
168
-
169
-
170
-
171
-
172
-
173
 |
 |
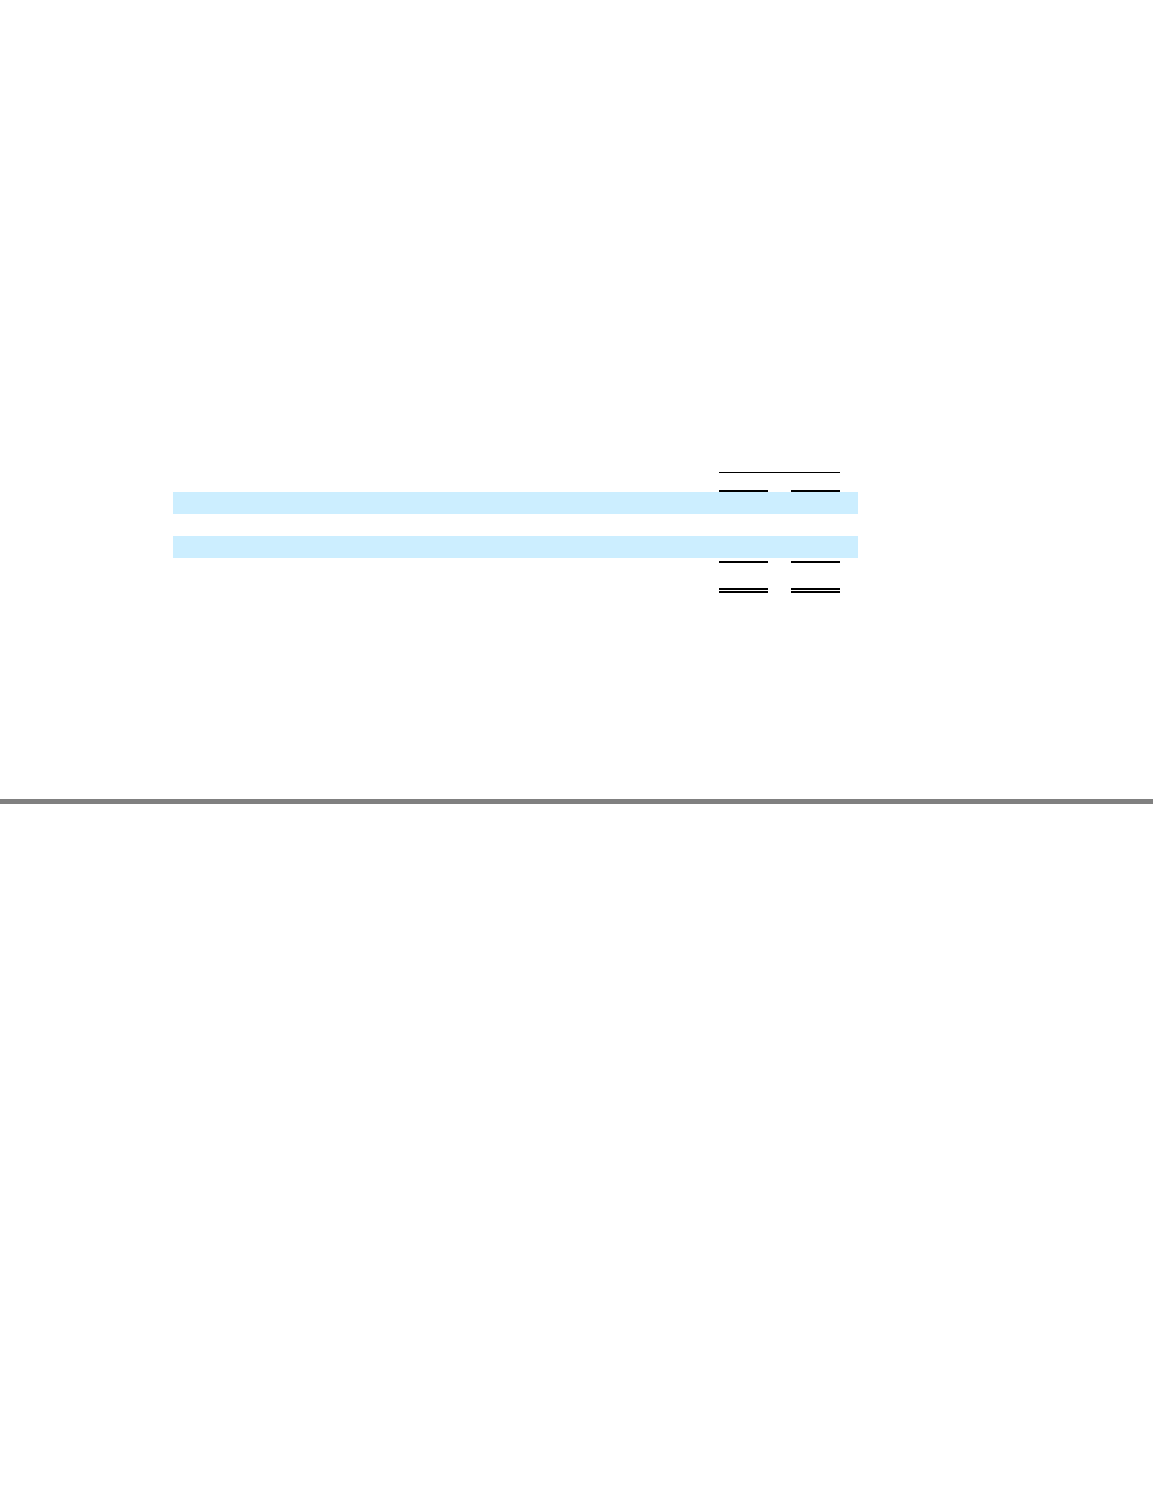
Table of Contents
maintenance, licensing and support fees in fiscal 2011 compared to fiscal 2010 as a result of capital expenditures and assets placed into service
in 2010.
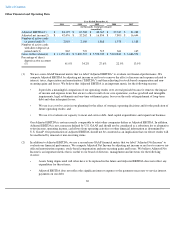
Depreciation and Amortization —Our depreciation and amortization costs were $15.0 million in fiscal 2011, an increase of $2.3 million,
or 18.1%, from fiscal 2010. This increase was primarily the result of increased depreciation resulting from capital expenditures and assets
placed into service in 2010.
Settlements and Other Losses —Settlements and other losses of $0.5 million during fiscal 2011 primarily related to severance and other
related restructuring costs incurred in connection with the consolidation of some of our processing platforms and call center activities. In fiscal
2010, settlements and other losses of $4.3 million related to a $3.5 million loss related to a patent infringement dispute and $0.8 million related
to a contractual dispute with an Issuing Bank.
Income Tax Expense
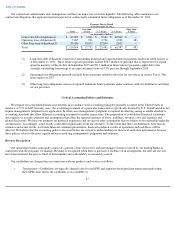
The following table presents the breakdown of our effective tax rate among federal, state and other taxes:
Our income tax expense was $21.8 million in fiscal 2011, an increase of $7.4 million from fiscal 2010. This increase in expense is due to
an increase in income before taxes combined with an increase in our effective tax rate. The increase in the effective rate from 2010 to 2011 was
primarily caused by a reduced amount of benefits related to research and development tax credits for internally developed software in 2011 as
compared to 2010.
40
Year Ended
December 31,
2011 2010
U.S. federal income tax
35.0
%
35.0
%
State income taxes, net of federal benefit
2.8
3.2
Other
1.8
0.5
Income tax expense
39.6
%
38.7
%